System Metrics
Kasm provides a System Metrics tool for monitoring the overall health of a Kasm deployment. Since Kasm is made up of multiple components, System Metrics continuously checks the status of those components to help ensure that the system remains healthy and synchronized.
The System Metrics dashboard provides a user-friendly interface for identifying warnings, reviewing system health, and troubleshooting critical issues.
Dashboard
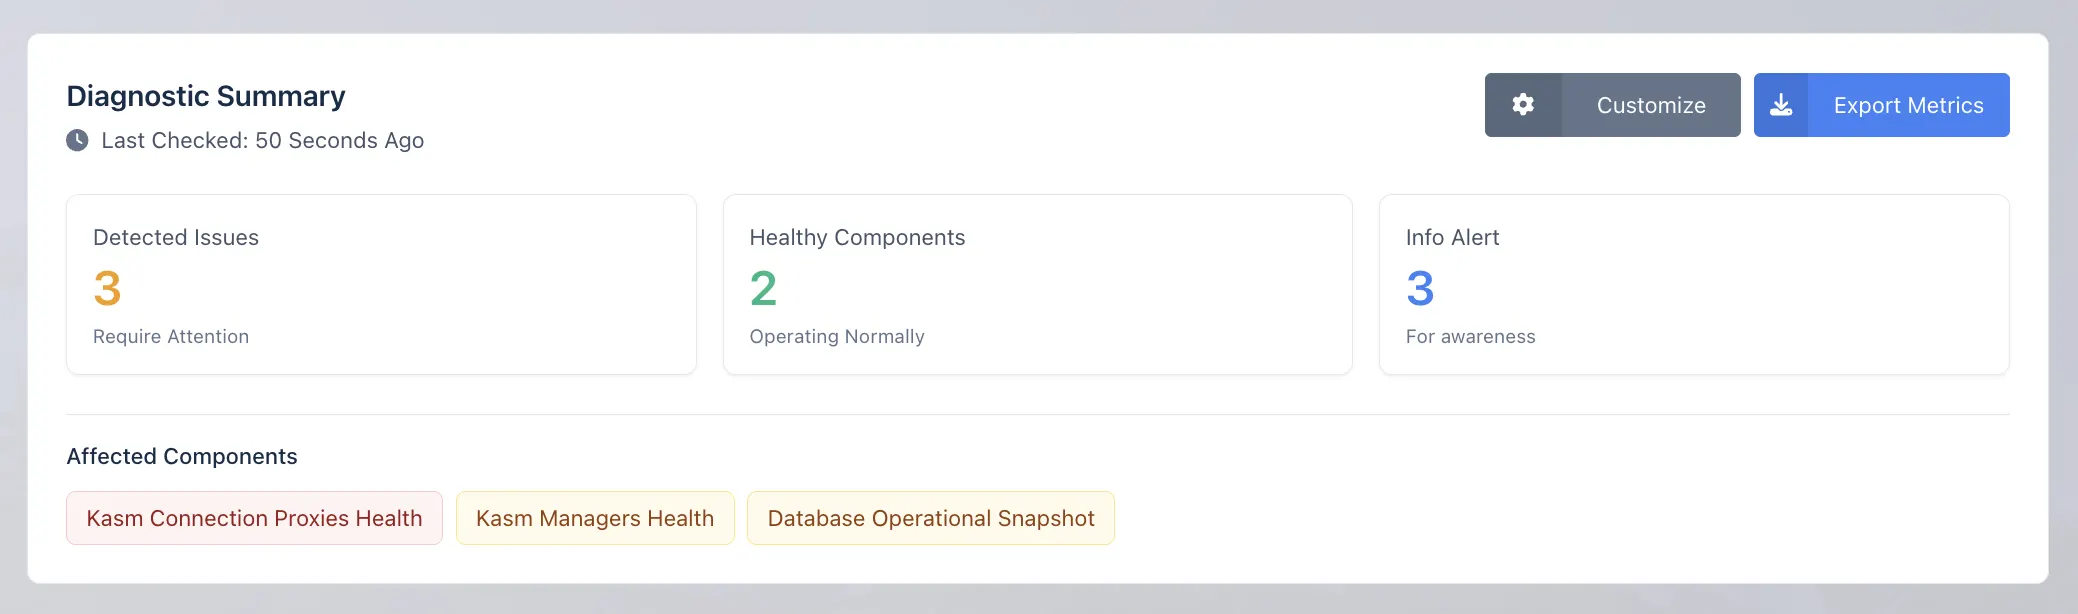
The System Metrics dashboard displays a diagnostic summary of the environment, including detected issues, healthy components, and informational alerts.
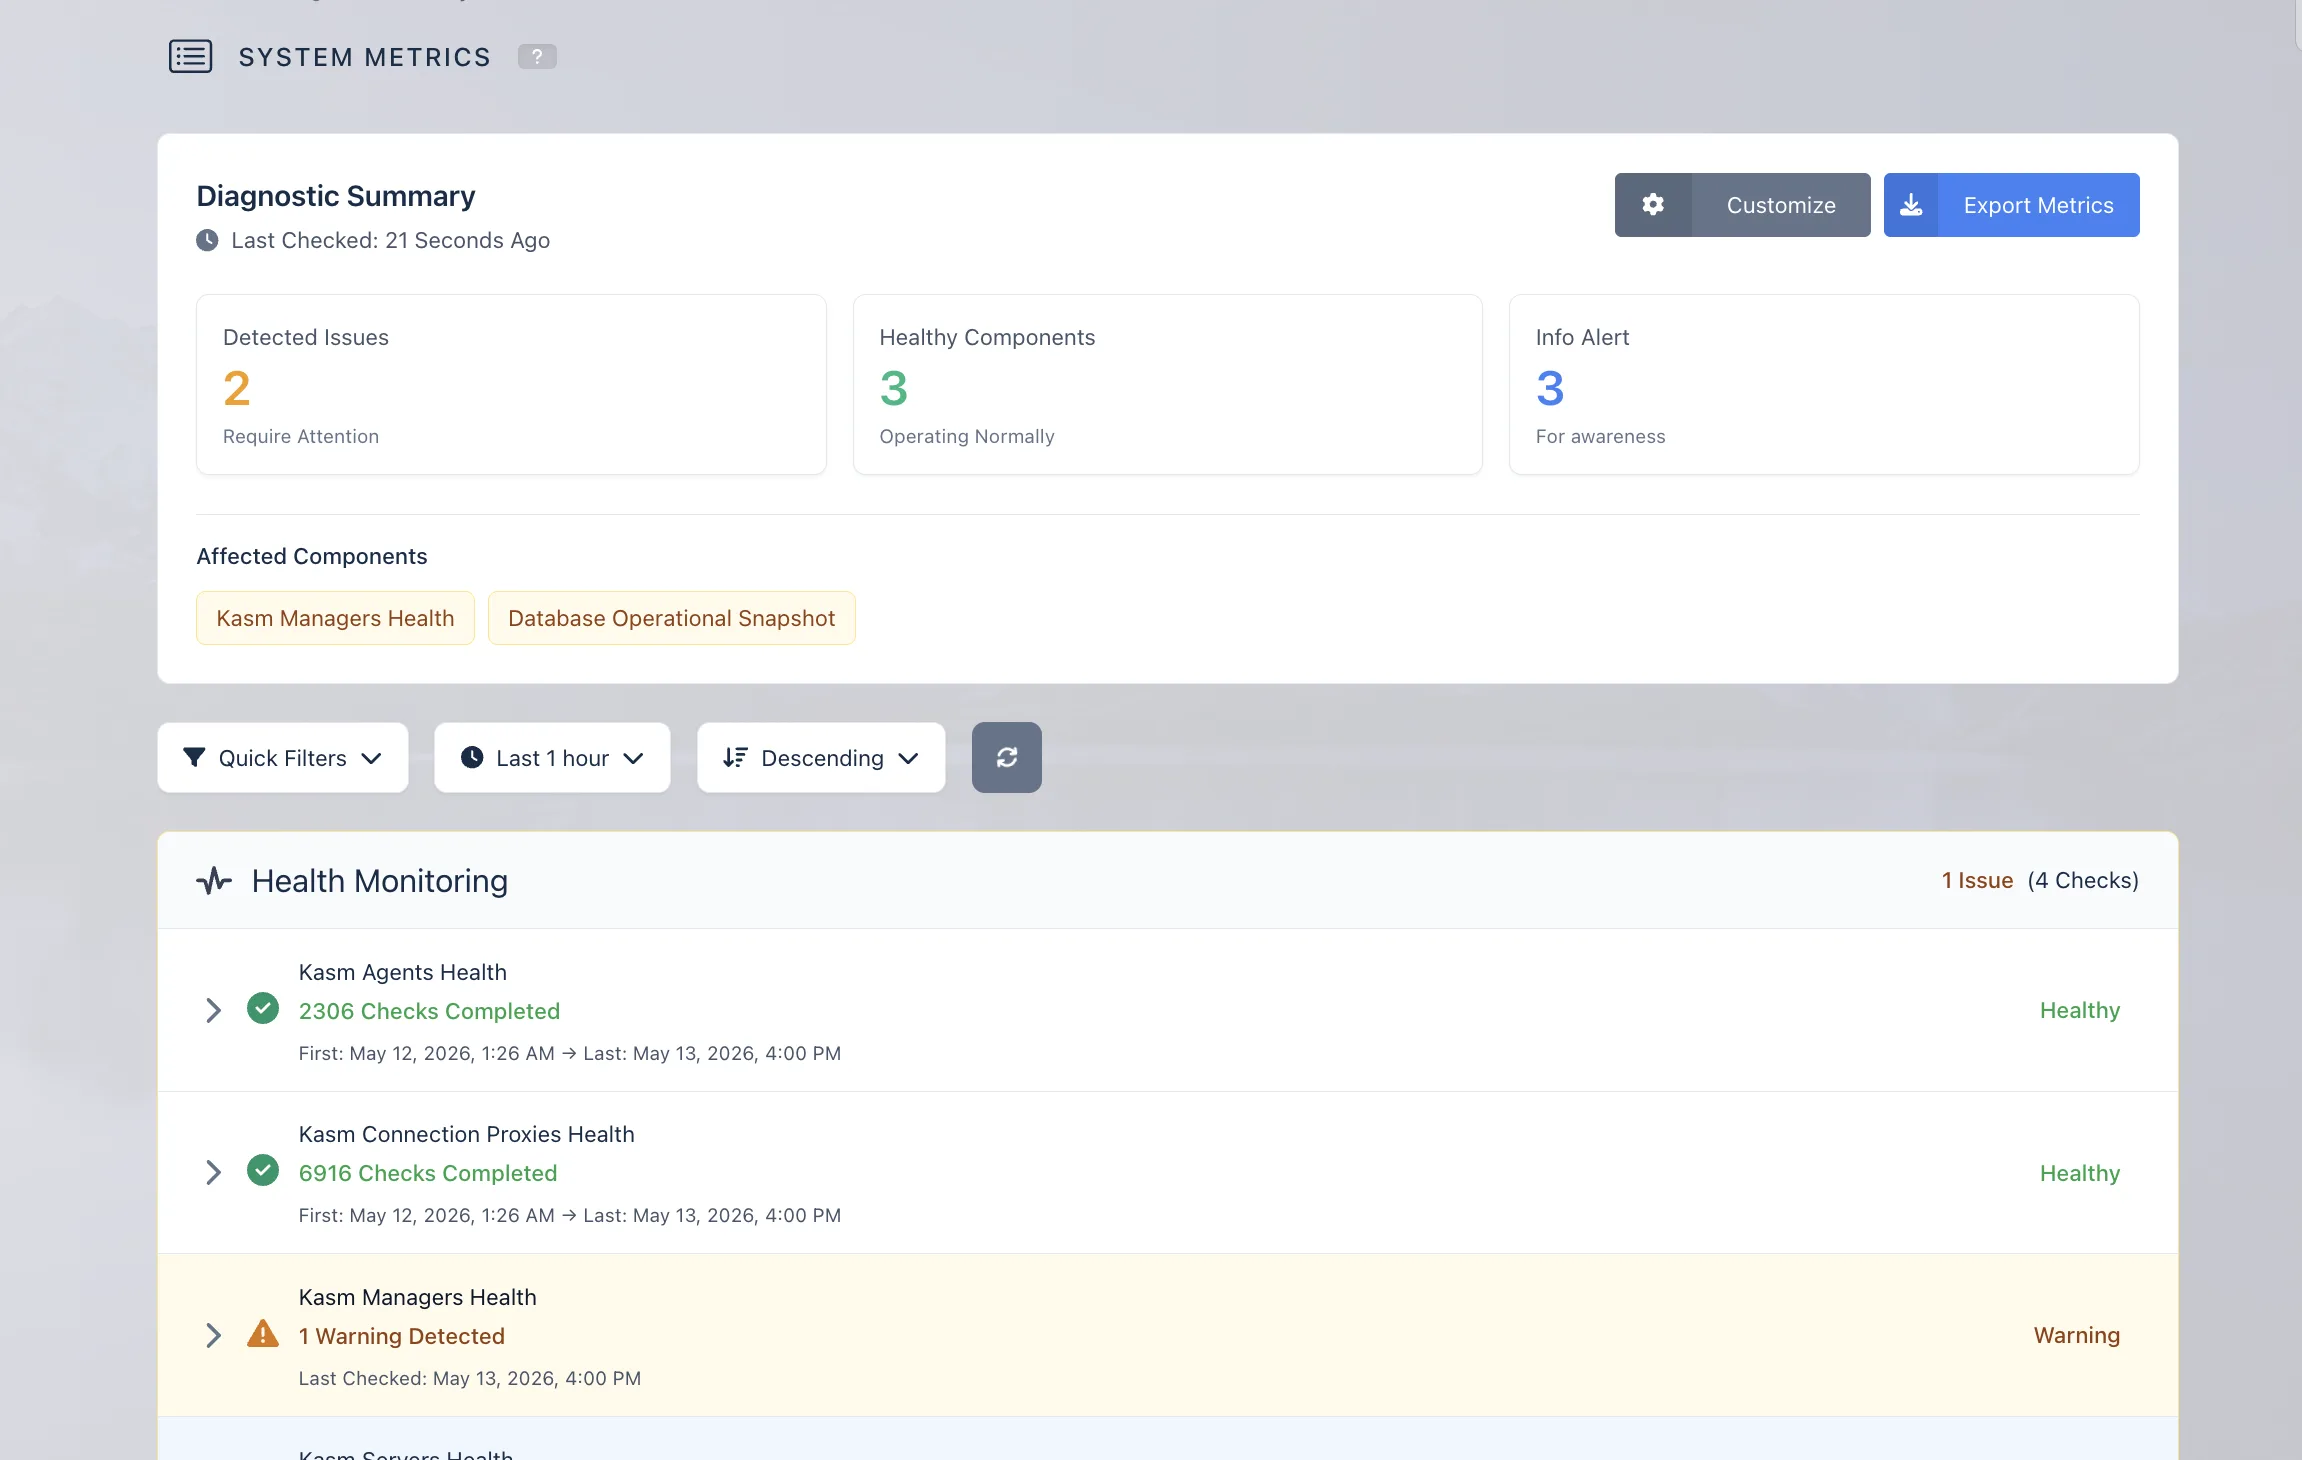
The dashboard helps administrators quickly understand the current health of the system and identify components that may require attention.
Status Colors
The dashboard uses status colors to indicate the severity and condition of each component.
- Green — Healthy: The component is operating normally.
- Blue — Info: General informational messages. For example, a message may indicate that there is no manager in a specific zone.
- Yellow — Warning: An early signal that a component may be unhealthy or requires attention.
- Red — Error: A critical component failure that may significantly impact the overall system.
System Component Groups
System Metrics organizes checks into two main component groups.
- Health Monitoring: Zone-based components.
- System Monitoring: Non-zone-based components.
System Component Health Checklist
The System Metrics dashboard includes checks for both health monitoring and system monitoring components.
Health Monitoring
Health Monitoring includes zone-based component checks such as:
- Kasm Managers Health
- Kasm Connection Proxies Health
- Kasm Servers Health
- Kasm Agents Health
System Monitoring
System Monitoring includes non-zone-based component checks such as:
- Database Operational Snapshot
- Kasm License Health
- Kasm Version Health
- Kasm Workspace Health
Metrics Overview
Each metrics component can be expanded to view performance logs captured within the selected time interval.
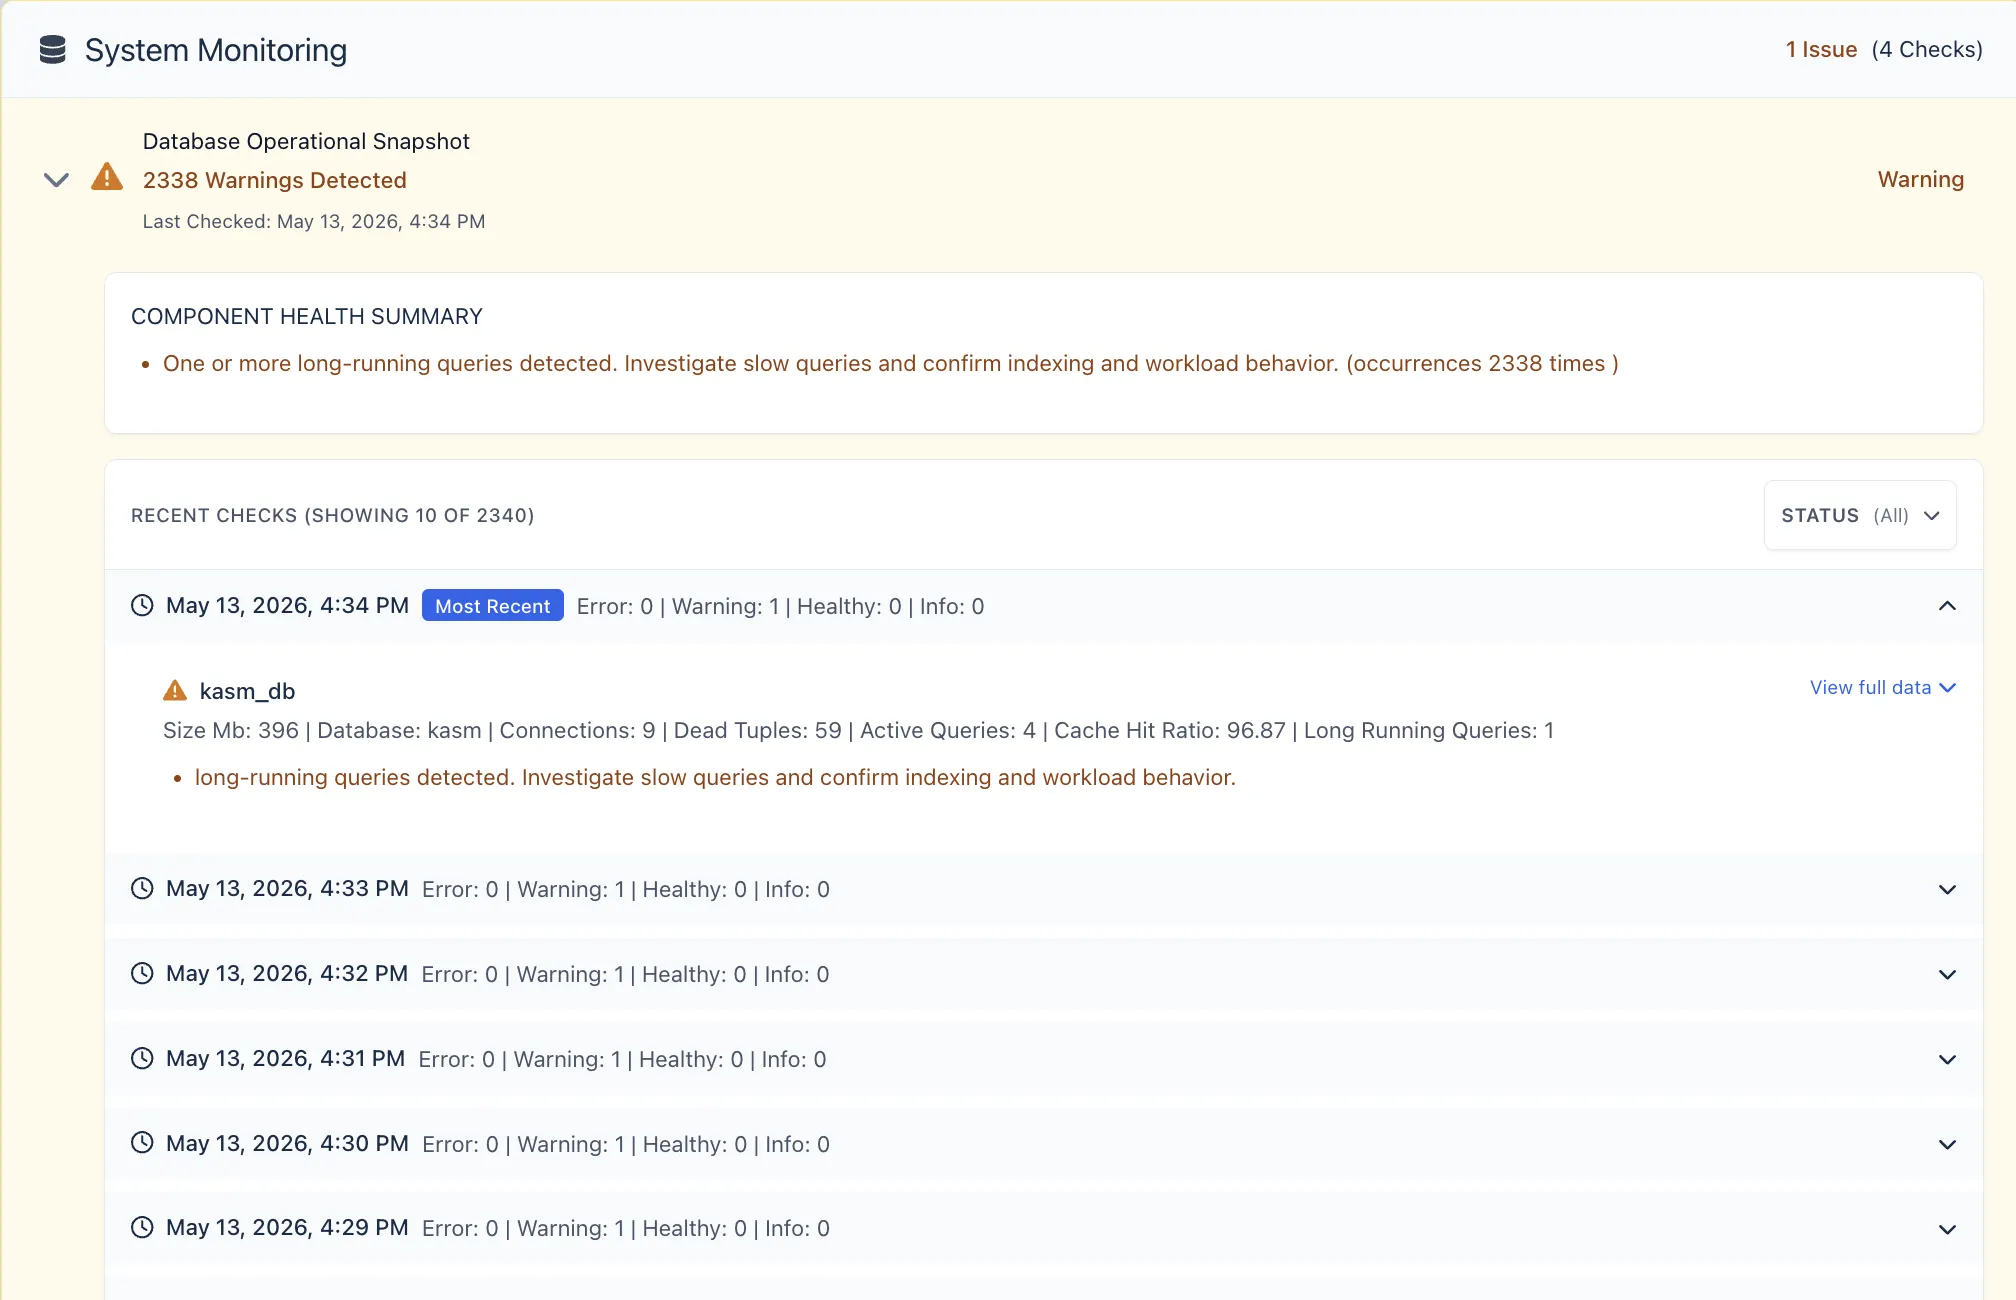
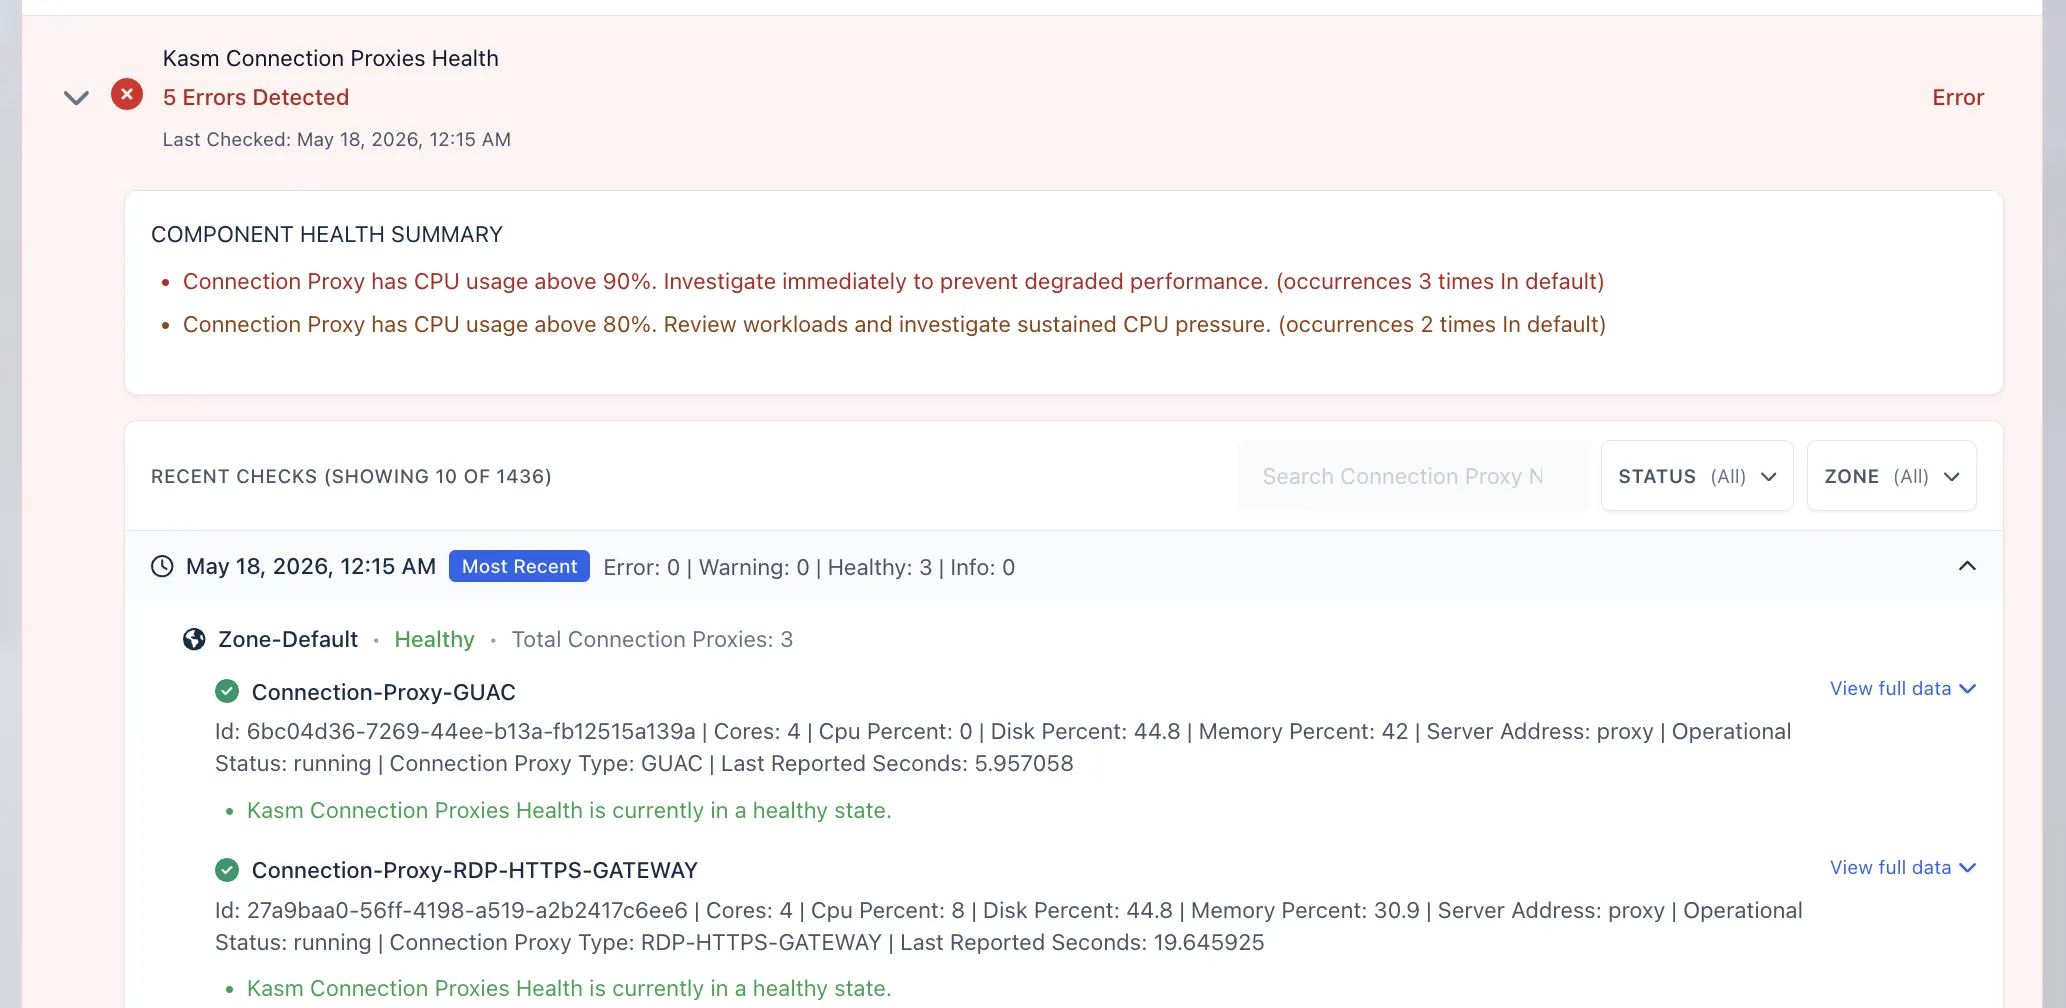
When a component is expanded, the dashboard displays recent checks and a component health summary. This summary provides a quick overview of the component status and helps administrators understand whether the issue is informational, a warning, or an error.
Administrators can filter checks by time span and status to investigate issues more easily.
Viewing Full Metric Data
For deeper troubleshooting, select View full data on a metric check.
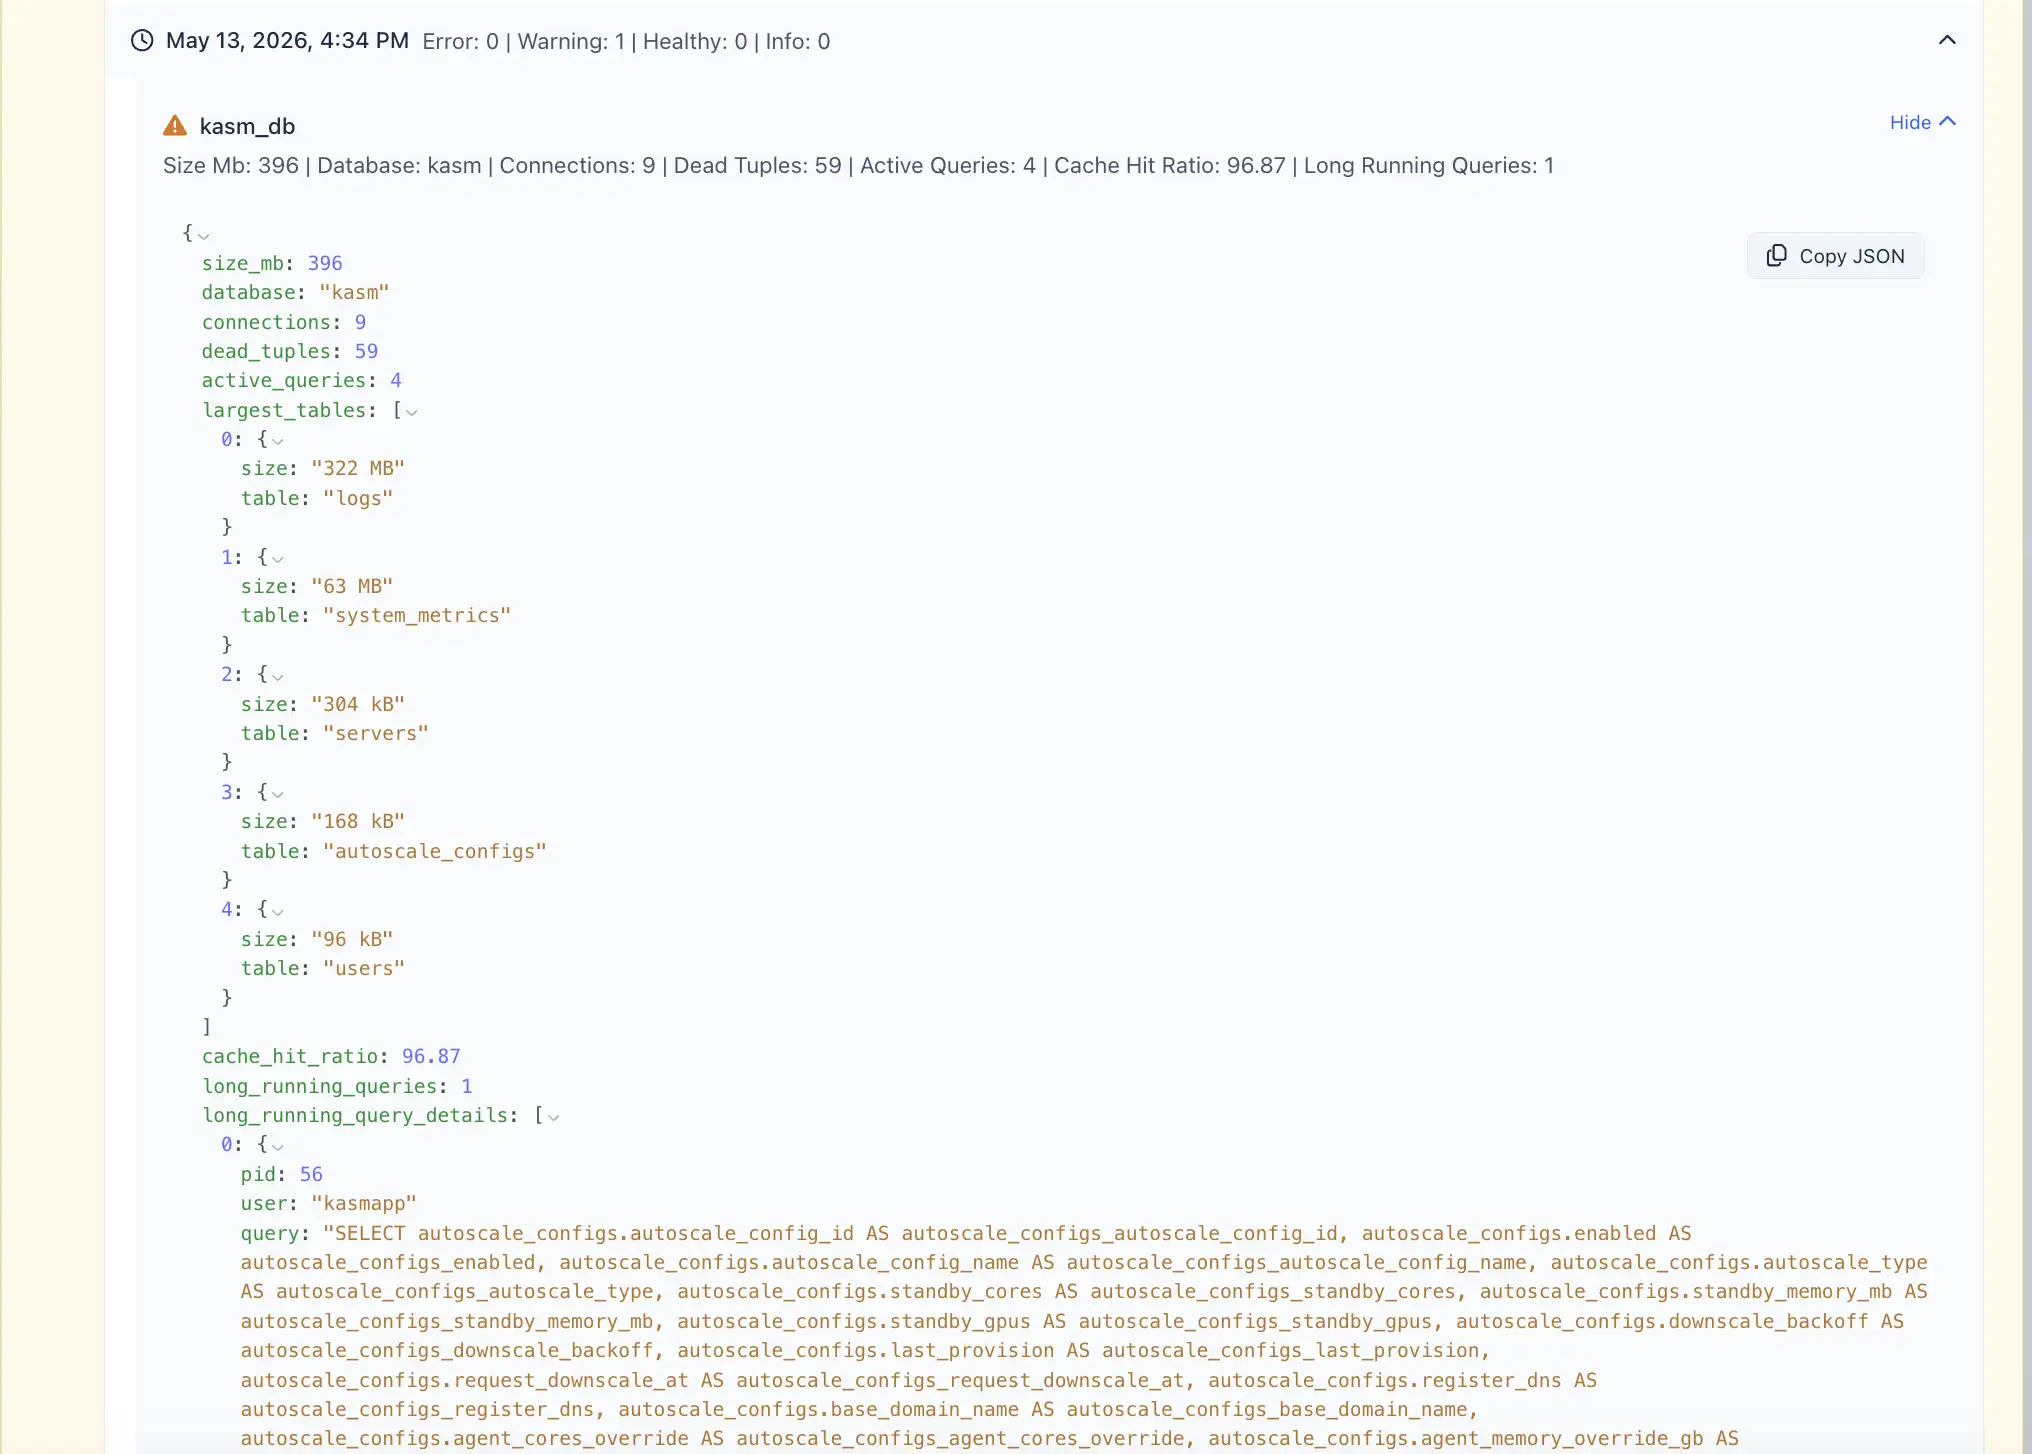
The full data view displays detailed metric output, including structured diagnostic data. This can help administrators identify the source of a problem and determine the appropriate fix.
For example, a database operational snapshot may include information such as:
- Database size
- Active database connections
- Dead tuples
- Active queries
- Cache hit ratio
- Long-running queries
- Table-level data
- Query details
This detailed output can be copied or reviewed directly from the dashboard during troubleshooting.
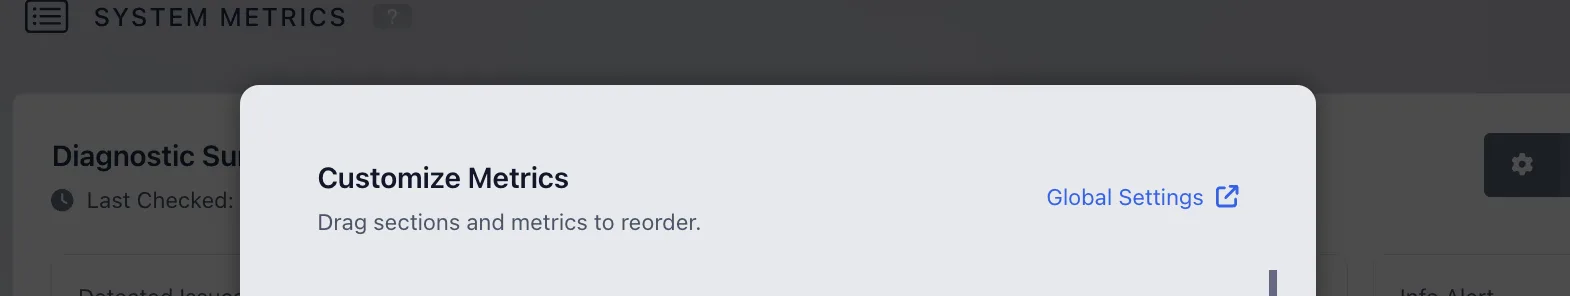
Customize the Dashboard
The System Metrics dashboard can be customized to better match the administrator's workflow.
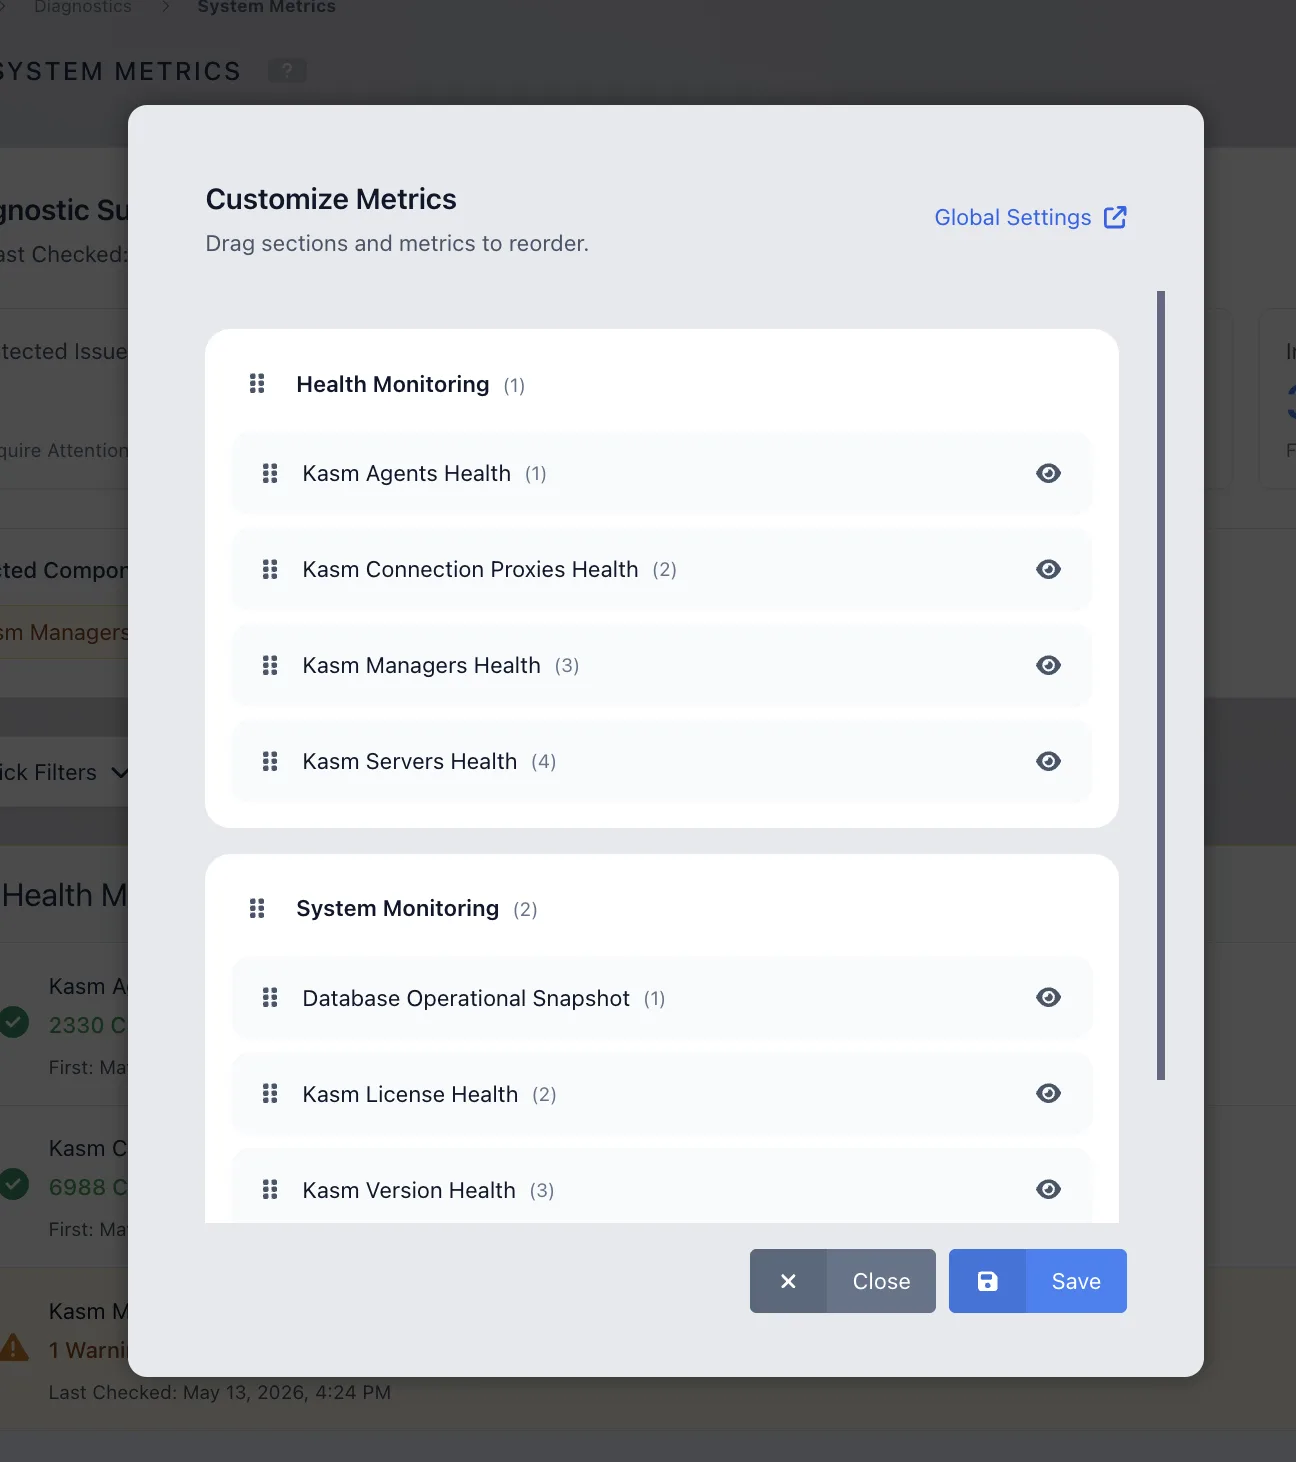
Administrators can customize the dashboard by rearranging the order of sections and metric components. Unwanted components can also be hidden from the dashboard.
To customize the dashboard:
- Open the Customize Metrics option.
- Drag sections or metrics to reorder them.
- Hide components that are not needed.
- Select Save to apply the changes.
Customization allows administrators to keep the most important system checks visible and organize the dashboard around the components they monitor most frequently.
System Metrics Checks
System Metrics runs a set of default health checks against core Kasm components. These checks are grouped into System Monitoring and Health Monitoring.
Each check can return one of the following statuses:
- Healthy: The component is operating normally.
- Info: The system has detected a condition that is useful to know but does not require immediate action.
- Warning: The system has detected a condition that may require investigation.
- Error: The system has detected a condition that may impact system stability or availability.
System Monitoring Checks
System Monitoring checks non-zone-based system components, including the database, license, Kasm version, and workspace images.
• Database Operational Snapshot
The Database Operational Snapshot check reviews database size, connections, replication state, and query behavior.
| Condition | Status | Message |
|---|---|---|
| Database size is greater than 10 GB and less than or equal to 100 GB. | Warning | Database size is above 10 GB. Review growth trends and confirm backups/retention policies are still appropriate. |
| Database size is greater than 100 GB. | Warning | Database size is above 100 GB. Investigate rapid growth, check storage capacity, and plan scaling/archival. |
| One or more long-running queries are detected. | Warning | One or more long-running queries detected. Investigate slow queries and confirm indexing and workload behavior. |
• Kasm License Health
The Kasm License Health check reviews whether a license exists and whether any configured licenses are close to expiration or already expired.
| Condition | Status | Message |
|---|---|---|
| No license is found. | Info | No license found. |
| One or more licenses expire within 30 days. | Warning | One or more licenses will expire within 30 days. Please plan to renew. |
| One or more licenses have expired. | Error | One or more licenses have expired. Please renew immediately to restore access. |
• Kasm Version Health
The Kasm Version Health check reviews whether a Kasm update is available.
| Condition | Status | Message |
|---|---|---|
| A Kasm update is available. | Warning | An update is available for Kasm. Review release notes and schedule an upgrade to stay current on fixes and security updates. |
• Kasm Container Workspaces Health
The Kasm Container Workspaces Health check reviews whether workspace images are available and healthy.
| Condition | Status | Message |
|---|---|---|
| No workspace data is available. | Info | No workspaces have been added yet. |
| Workspace image data is stale, unavailable, or missing from the agent. | Error | Workspace images are unhealthy: image is stale/unavailable or missing on the agent. Check image sync/pulls, agent connectivity, and registry access. |
Health Monitoring Checks
Health Monitoring checks zone-based components such as Managers, Servers, Agents, and Connection Proxies.
• Kasm Managers Health
The Kasm Managers Health check reviews Manager availability, operational status, managed server status, and resource usage.
| Condition | Status | Message |
|---|---|---|
| No Manager data is available. | Info | No Manager data found. |
Manager status is not running or deleting. | Error | Manager is not in an expected state (running/deleting). Check server health, capacity, and recent failures. |
One or more Manager-managed servers are not running or deleting. | Error | Manager-managed servers are not in an expected state (running/deleting). Check the affected server(s) and recent events/logs. |
| Manager memory usage is above 80%. | Warning | Manager nodes have memory usage above 80%. Investigate memory pressure, workloads, and capacity trends. |
| Manager memory usage is above 90%. | Error | Manager nodes have memory usage above 90%. Investigate immediately to prevent instability (check processes, workloads, and capacity). |
| Manager CPU usage is above 80%. | Warning | Manager nodes have CPU usage above 80%. Review workloads and investigate sustained CPU pressure. |
| Manager CPU usage is above 90%. | Error | Manager nodes have CPU usage above 90%. Investigate immediately to prevent degraded performance. |
| Manager disk usage is above 80%. | Warning | Manager nodes have disk usage above 80%. Review storage growth and plan cleanup/expansion. |
| Manager disk usage is above 90%. | Error | Manager nodes have disk usage above 90%. Take action immediately (cleanup/expand) to avoid outages. |
• Kasm Servers Health
The Kasm Servers Health check reviews Server availability, operational status, and resource usage.
| Condition | Status | Message |
|---|---|---|
| No Server data is available. | Info | No Server data found. |
Server status is not running or deleting. | Error | Server is not in an expected state (running/deleting). Check server health, capacity, and recent failures. |
| Server memory usage is above 80%. | Warning | Server has memory usage above 80%. Investigate memory pressure, workloads, and capacity trends. |
| Server memory usage is above 90%. | Error | Server has memory usage above 90%. Investigate immediately to prevent instability. |
| Server CPU usage is above 80%. | Warning | Server has CPU usage above 80%. Review workloads and investigate sustained CPU pressure. |
| Server CPU usage is above 90%. | Error | Server has CPU usage above 90%. Investigate immediately to prevent degraded performance. |
| Server disk usage is above 80%. | Warning | Server has disk usage above 80%. Review storage growth and plan cleanup/expansion. |
| Server disk usage is above 90%. | Error | Server has disk usage above 90%. Take action immediately (cleanup/expand) to avoid outages. |
• Kasm Agents Health
The Kasm Agents Health check reviews Agent availability, operational status, and resource usage.
| Condition | Status | Message |
|---|---|---|
| No Agent data is available. | Info | No Agents data found. |
Agent status is not running or deleting. | Error | Agent is not in an expected state (running/deleting). Check server health, capacity, and recent failures. |
| Agent memory usage is above 80%. | Warning | Agent has memory usage above 80%. Investigate memory pressure, workloads, and capacity trends. |
| Agent memory usage is above 90%. | Error | Agent has memory usage above 90%. Investigate immediately to prevent instability. |
| Agent CPU usage is above 80%. | Warning | Agent has CPU usage above 80%. Review workloads and investigate sustained CPU pressure. |
| Agent CPU usage is above 90%. | Error | Agent has CPU usage above 90%. Investigate immediately to prevent degraded performance. |
| Agent disk usage is above 80%. | Warning | Agent has disk usage above 80%. Review storage growth and plan cleanup/expansion. |
| Agent disk usage is above 90%. | Error | Agent has disk usage above 90%. Take action immediately (cleanup/expand) to avoid outages. |
• Kasm Connection Proxies Health
The Kasm Connection Proxies Health check reviews Connection Proxy availability, operational status, and resource usage.
| Condition | Status | Message |
|---|---|---|
| No Connection Proxy data is available. | Info | No Connection Proxy data found. |
Connection Proxy status is not running or deleting. | Error | Connection Proxy is not in an expected state (running/deleting). Verify proxy service status and network reachability. |
| Connection Proxy memory usage is above 80%. | Warning | Connection Proxy has memory usage above 80%. Investigate memory pressure, workloads, and capacity trends. |
| Connection Proxy memory usage is above 90%. | Error | Connection Proxy has memory usage above 90%. Investigate immediately to prevent instability. |
| Connection Proxy CPU usage is above 80%. | Warning | Connection Proxy has CPU usage above 80%. Review workloads and investigate sustained CPU pressure. |
| Connection Proxy CPU usage is above 90%. | Error | Connection Proxy has CPU usage above 90%. Investigate immediately to prevent degraded performance. |
| Connection Proxy disk usage is above 80%. | Warning | Connection Proxy has disk usage above 80%. Review storage growth and plan cleanup/expansion. |
| Connection Proxy disk usage is above 90%. | Error | Connection Proxy has disk usage above 90%. Take action immediately (cleanup/expand) to avoid outages. |
Resource Usage Thresholds
Several Health Monitoring checks use the same resource thresholds across Managers, Servers, Agents, and Connection Proxies.
| Resource | Warning Threshold | Error Threshold |
|---|---|---|
| Memory usage | Above 80% | Above 90% |
| CPU usage | Above 80% | Above 90% |
| Disk usage | Above 80% | Above 90% |
When a warning threshold is reached, administrators should review the affected component and investigate capacity trends. When an error threshold is reached, administrators should take action immediately to prevent degraded performance or outages.
Diagnosing System Problems
The System Metrics dashboard helps administrators quickly identify affected components, review health summaries, and inspect detailed metric data for troubleshooting.
1. Review the Diagnostic Summary
Start from the Diagnostic Summary section at the top of the System Metrics dashboard.
This section shows a list of Affected Components. Each affected component represents a metric check that has detected an issue, warning, or informational alert.
Click an affected component to automatically scroll to the related health check section on the dashboard.
2. Expand the Affected Component and Review the Health Summary
After selecting an affected component, expand the related health check by clicking the toggle next to the component name.
When expanded, the component displays an overview of the health checks and metrics recorded over time. The first section inside the expanded details is the Component Health Summary.
The Component Health Summary provides a quick explanation of the issue detected by System Metrics. It may include:
- The problem that was found
- How many times the problem occurred within the selected time range
- The affected zone, when zone data is applicable
- The severity of the issue
The text color indicates the type of alert:
| Color | Status | Meaning |
|---|---|---|
| Red | Error | A critical issue was detected and should be investigated immediately. |
| Yellow | Warning | A potential issue was detected and may require attention. |
| Blue | Info | Informational details are available for review. |
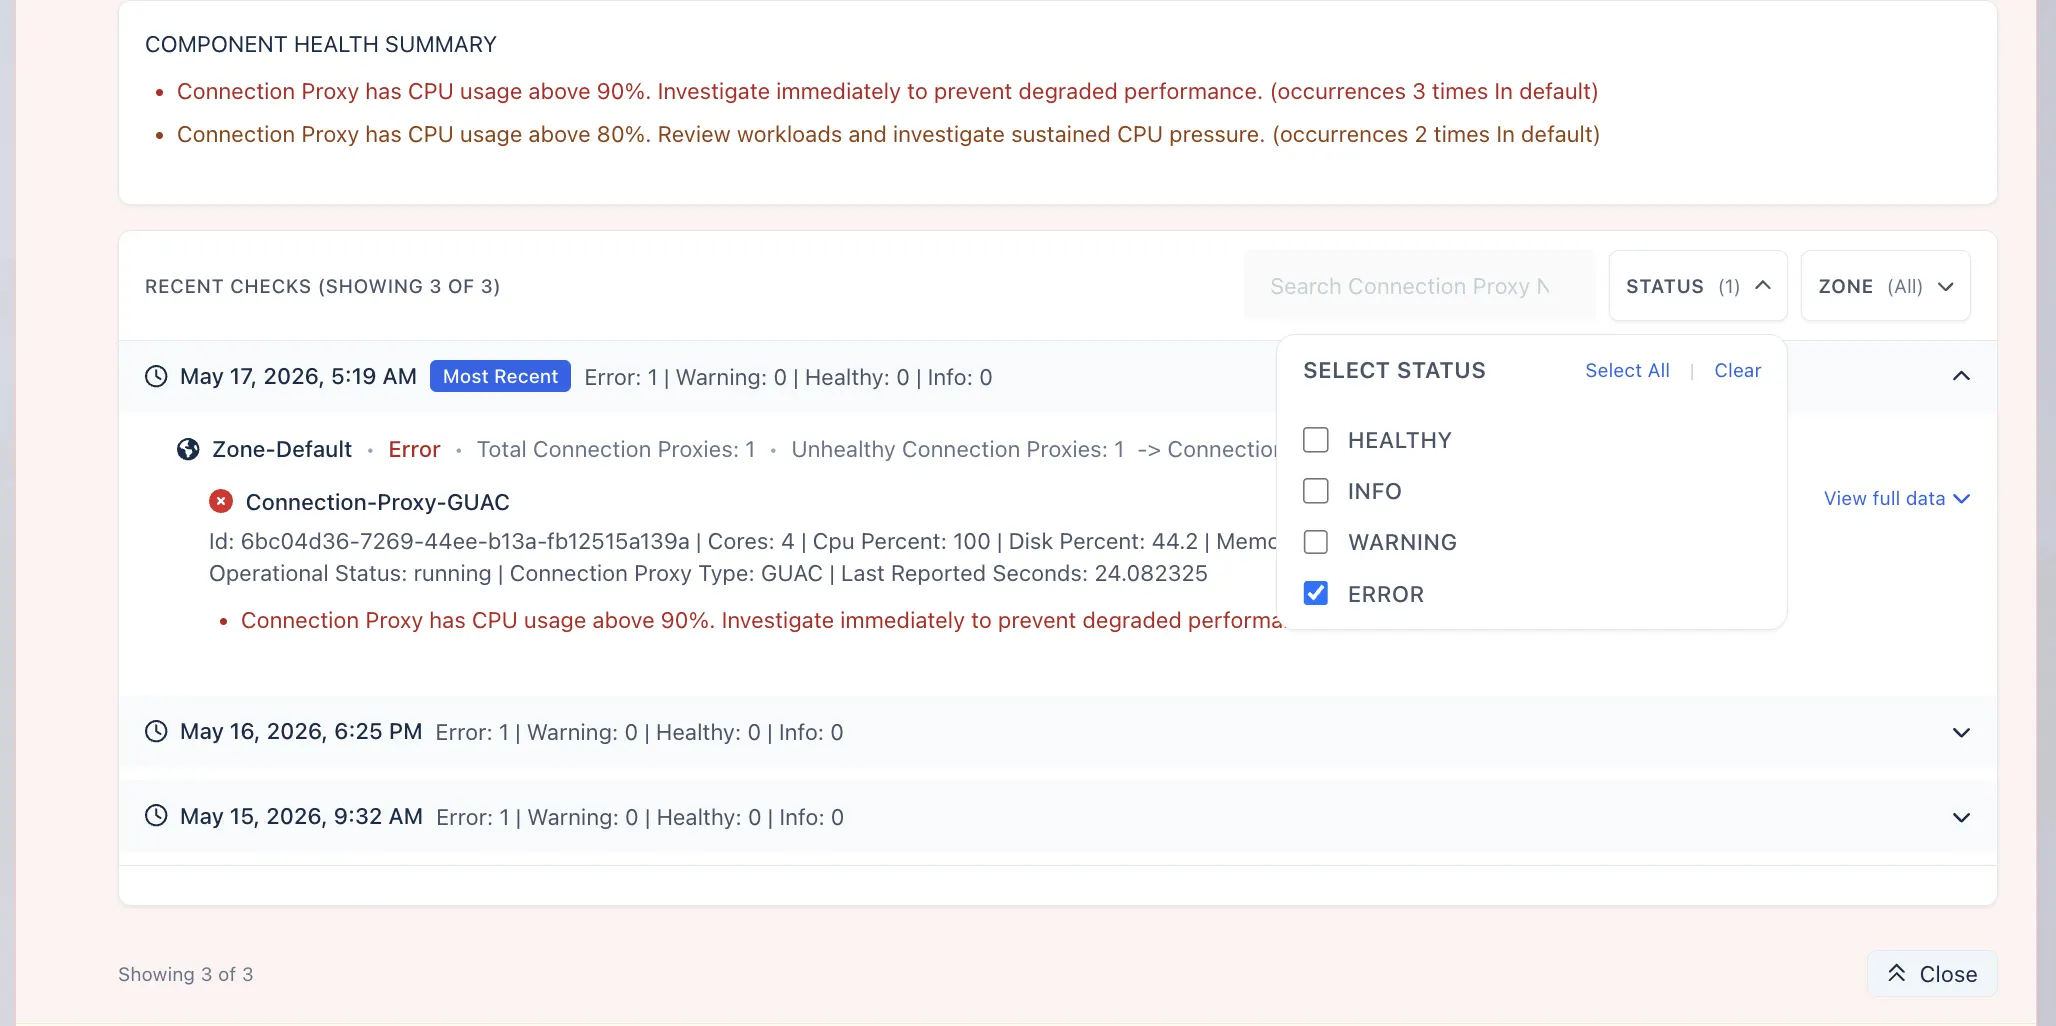
3. Filter the Recorded Checks
Use the available filters to narrow the results based on the type of issue you want to investigate.
For example, you can filter by:
- Status, such as Error, Warning, Info, or Healthy
- Zone, when the component is zone-based
- Time range, to review checks from a specific period
Filtering helps reduce noise and makes it easier to focus on the affected checks.
Each recorded check provides a snapshot of the component state at that time. The snapshot may include the reason the check failed, related metric values, and additional metadata that can help with troubleshooting.
4. View Full Metric Data
For deeper troubleshooting, click View full data on a recorded check.
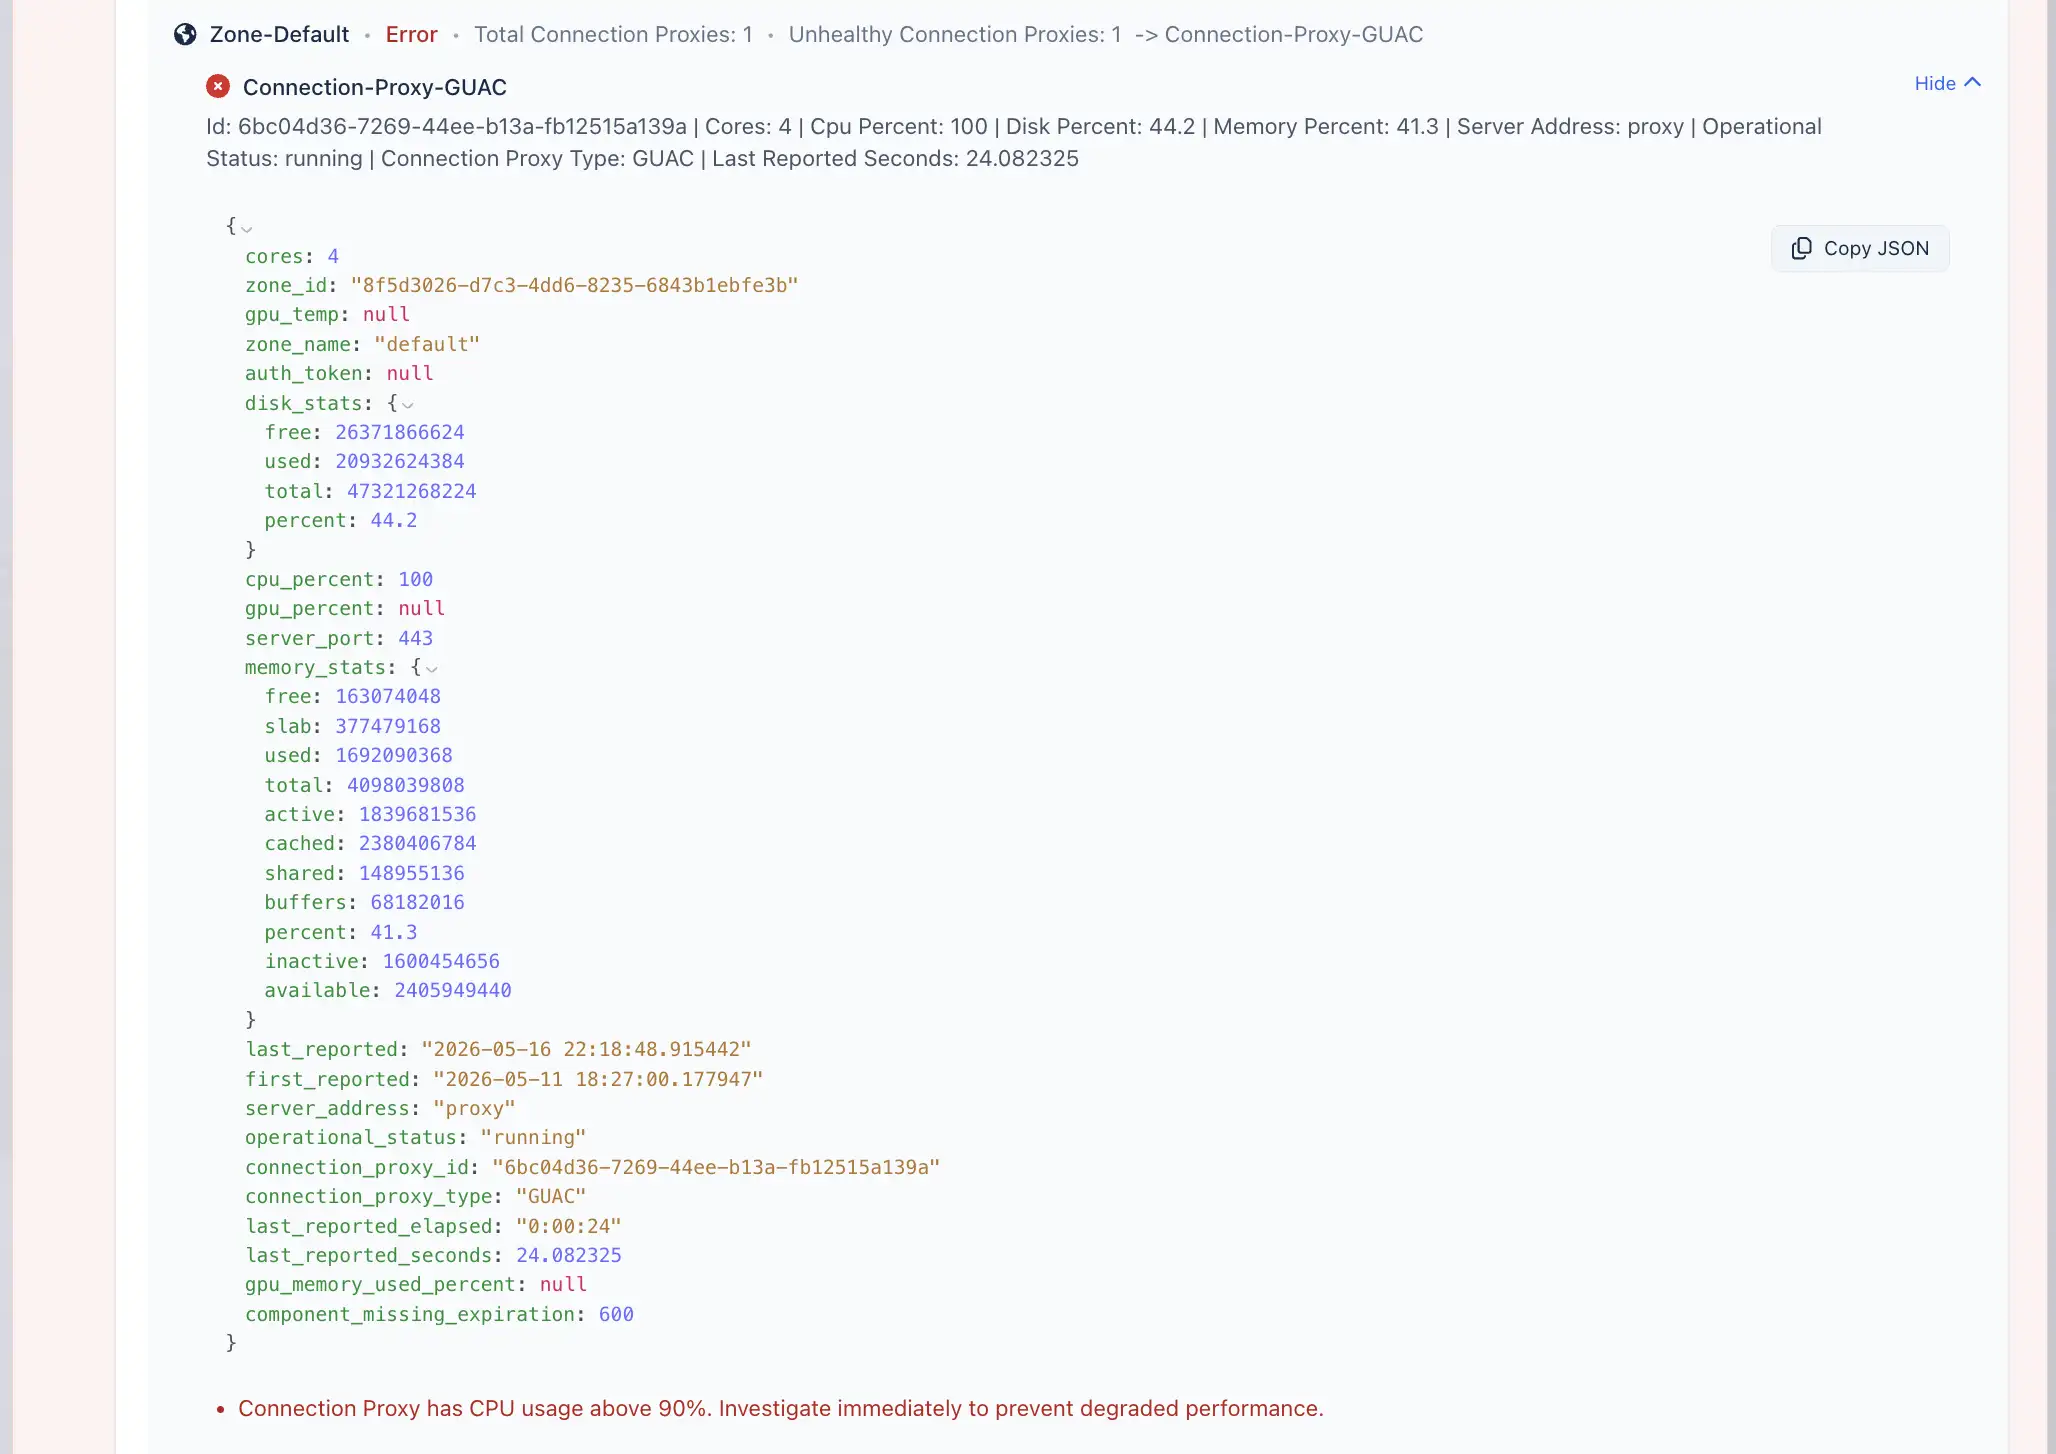
The full data view displays the complete metric payload for that check. This can include detailed system metadata, resource usage, database details, query information, or other component-specific diagnostic data.
Use this view when the summary does not provide enough information and you need to inspect the underlying metric data in more detail.
Global Settings
System Metrics can be configured from the Global Settings page. These settings control whether System Metrics is enabled, how often metrics are collected, and how many metric records are retained for each component.
You can open these settings directly from the Customize Metrics modal by clicking the Global Settings button. This redirects you to the Global Settings page, where the System Metrics settings can be reviewed and updated.
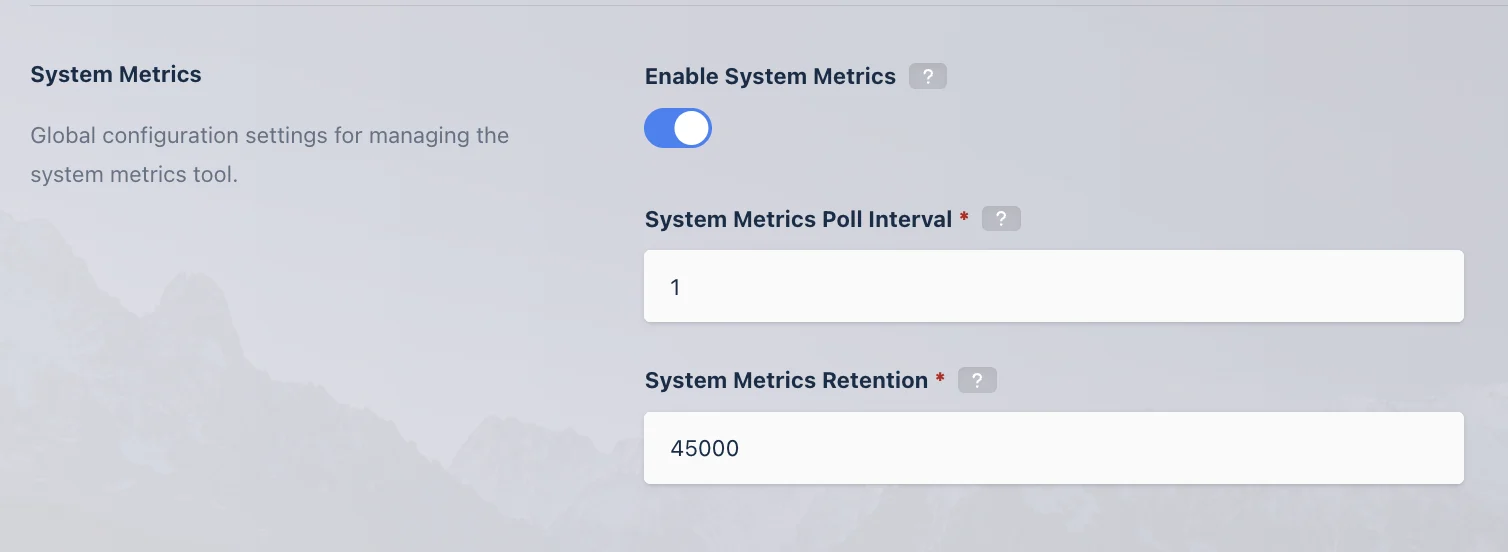
The following global settings are available for System Metrics:
| Setting | Description |
|---|---|
Enable System Metrics | When enabled, the backend System Metrics Module periodically collects snapshot logs for all essential components, checks their health, and displays the data on the System Metrics page. |
System Metrics Poll Interval | Specifies the time interval, in minutes, at which the system collects and evaluates system metrics. |
System Metrics Retention | Specifies the number of system metrics records to retain per component. Use caution when adjusting this value, as increasing retention may increase stored metric data. |
For more information about configuring global settings, see the Global Settings documentation.