System Metrics
System Metrics is the built-in monitoring tool that reports the operational health of a Kasm Workspaces deployment. A Kasm Workspaces deployment runs multiple components, so System Metrics continuously evaluates each component and surfaces healthy, informational, warning, and error conditions on a single dashboard. The sections below describe the status colors, component groups, per-component checks, resource thresholds, and global settings that govern System Metrics monitoring.
Where System Metrics lives
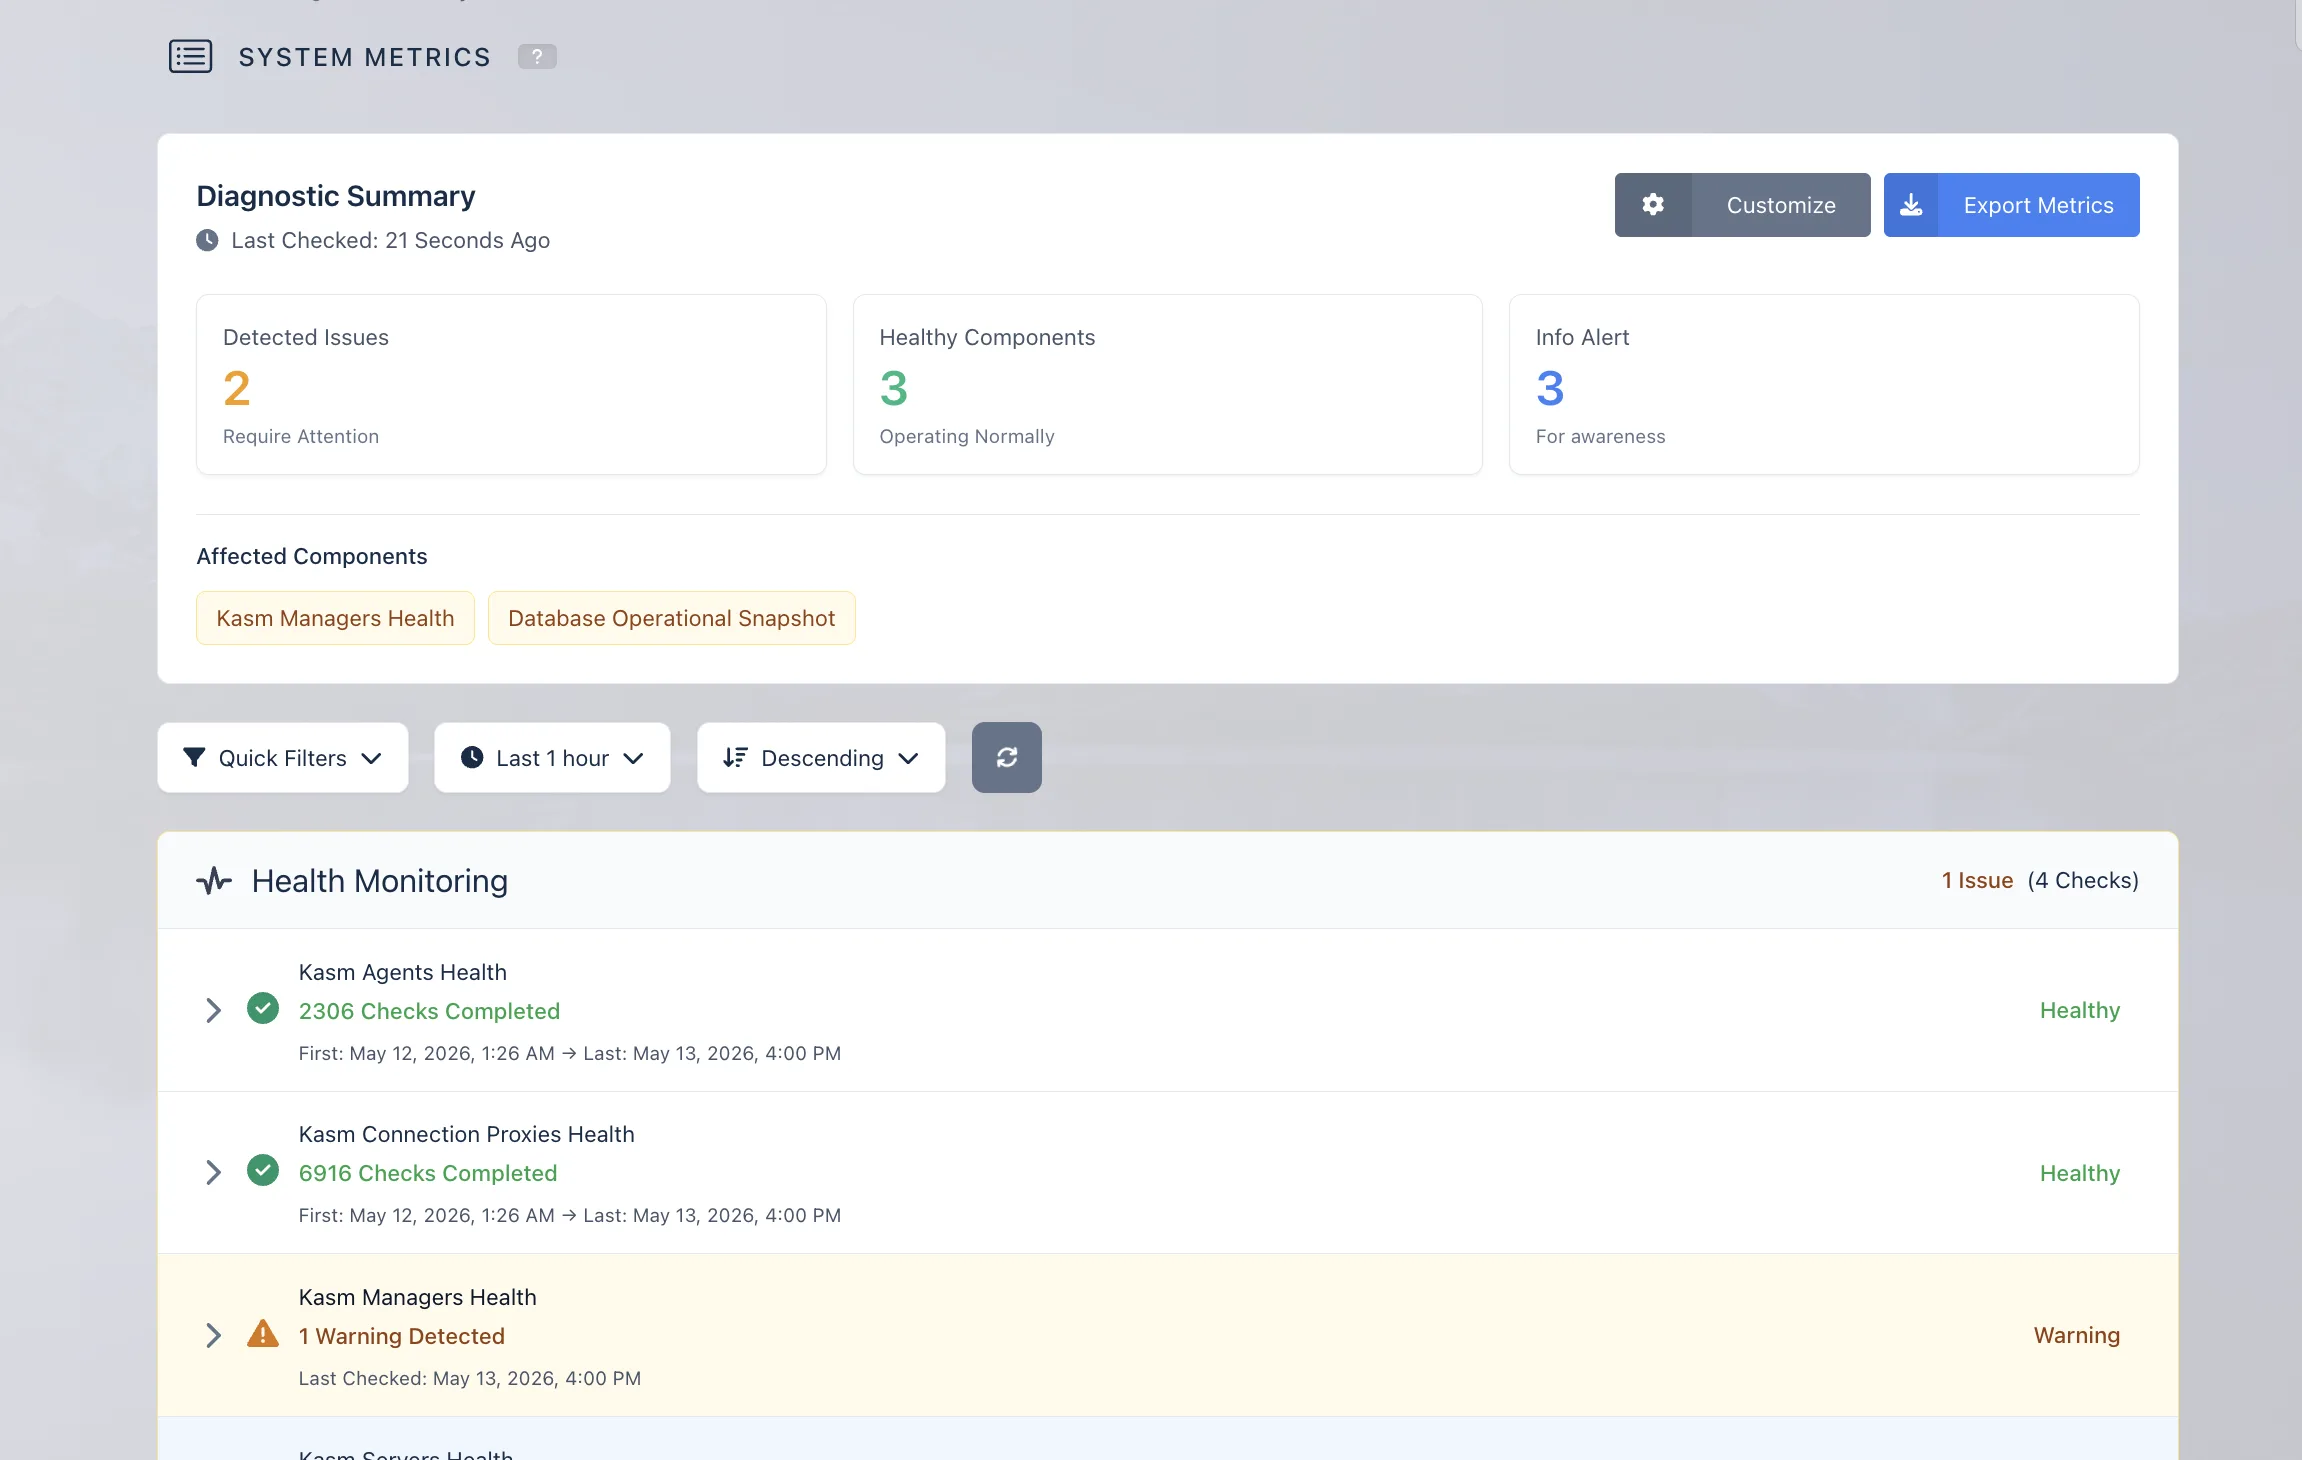
System Metrics is an Administrator-facing tool inside the Kasm Workspaces UI. The dashboard presents a diagnostic summary of the deployment, including detected issues, healthy components, and informational alerts.
Status colors
The dashboard maps each check result to one of four statuses and colors. Every status legend on the dashboard uses the same mapping.
| Color | Status | Meaning |
|---|---|---|
| Green | Healthy | The component is operating normally. |
| Blue | Info | An informational condition that is useful to know but requires no immediate action. |
| Yellow | Warning | An early signal that a component may be unhealthy or requires investigation. |
| Red | Error | A critical condition that may impact system stability or availability. |
System component groups
System Metrics organizes checks into two component groups.
| Group | Scope | Components |
|---|---|---|
| Health Monitoring | Zone-based components | Kasm Managers, Kasm Connection Proxies, Kasm Servers, Kasm Agents |
| System Monitoring | Non-zone-based components | Database, Kasm license, Kasm version, Kasm Container Workspaces |
Dashboard views
The dashboard provides a fixed set of views for inspecting component health.
Diagnostic summary
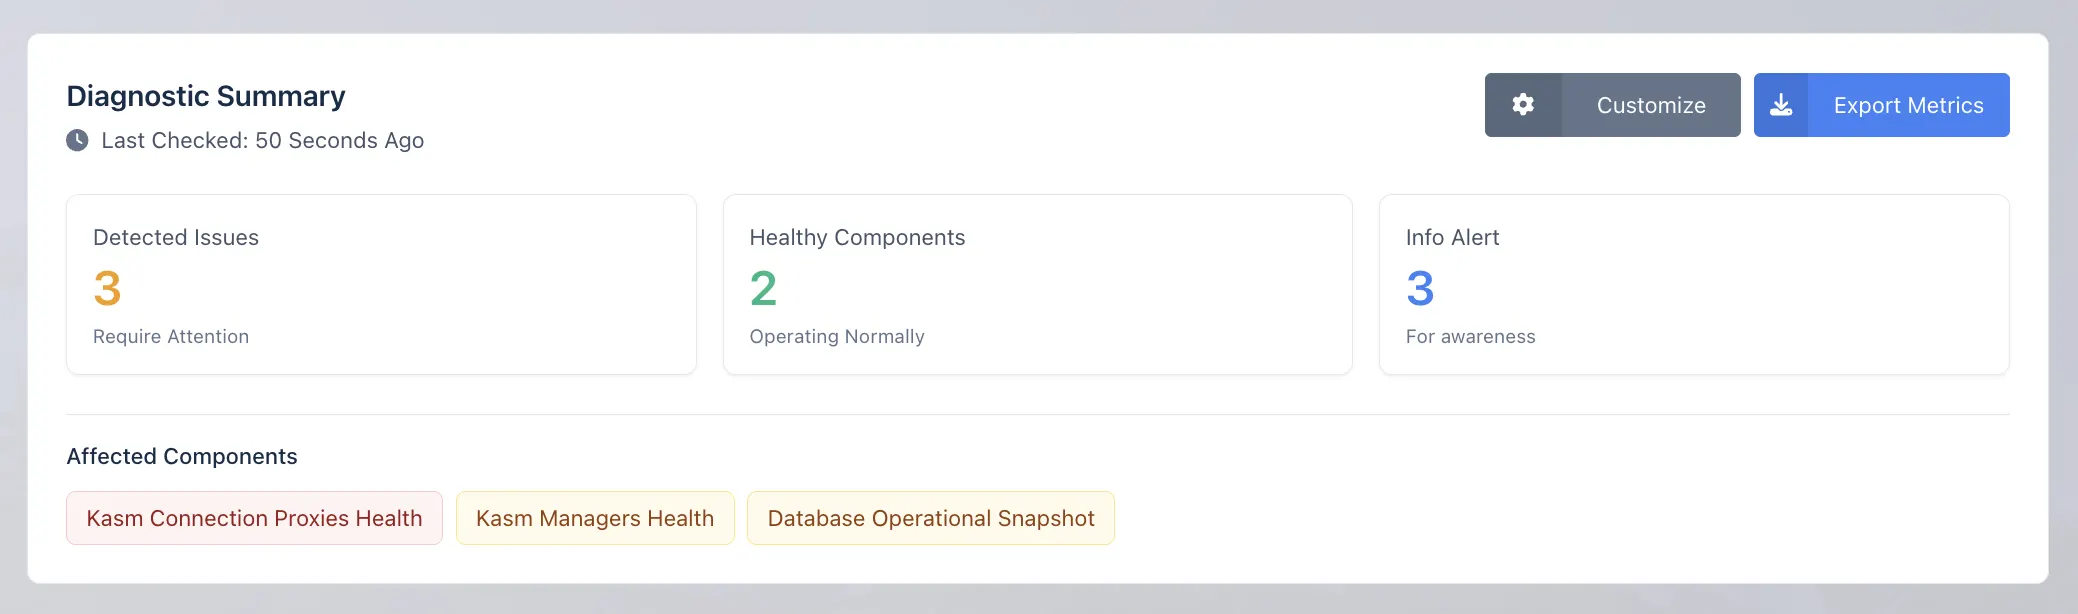
The diagnostic summary appears at the top of the dashboard and lists affected components. Each affected component represents a check that has detected an issue, warning, or informational condition. Selecting an affected component scrolls to its health check section.
Expanded component view
Each component expands to show recent checks and a component health summary recorded within the selected time interval. The component health summary describes the detected condition.
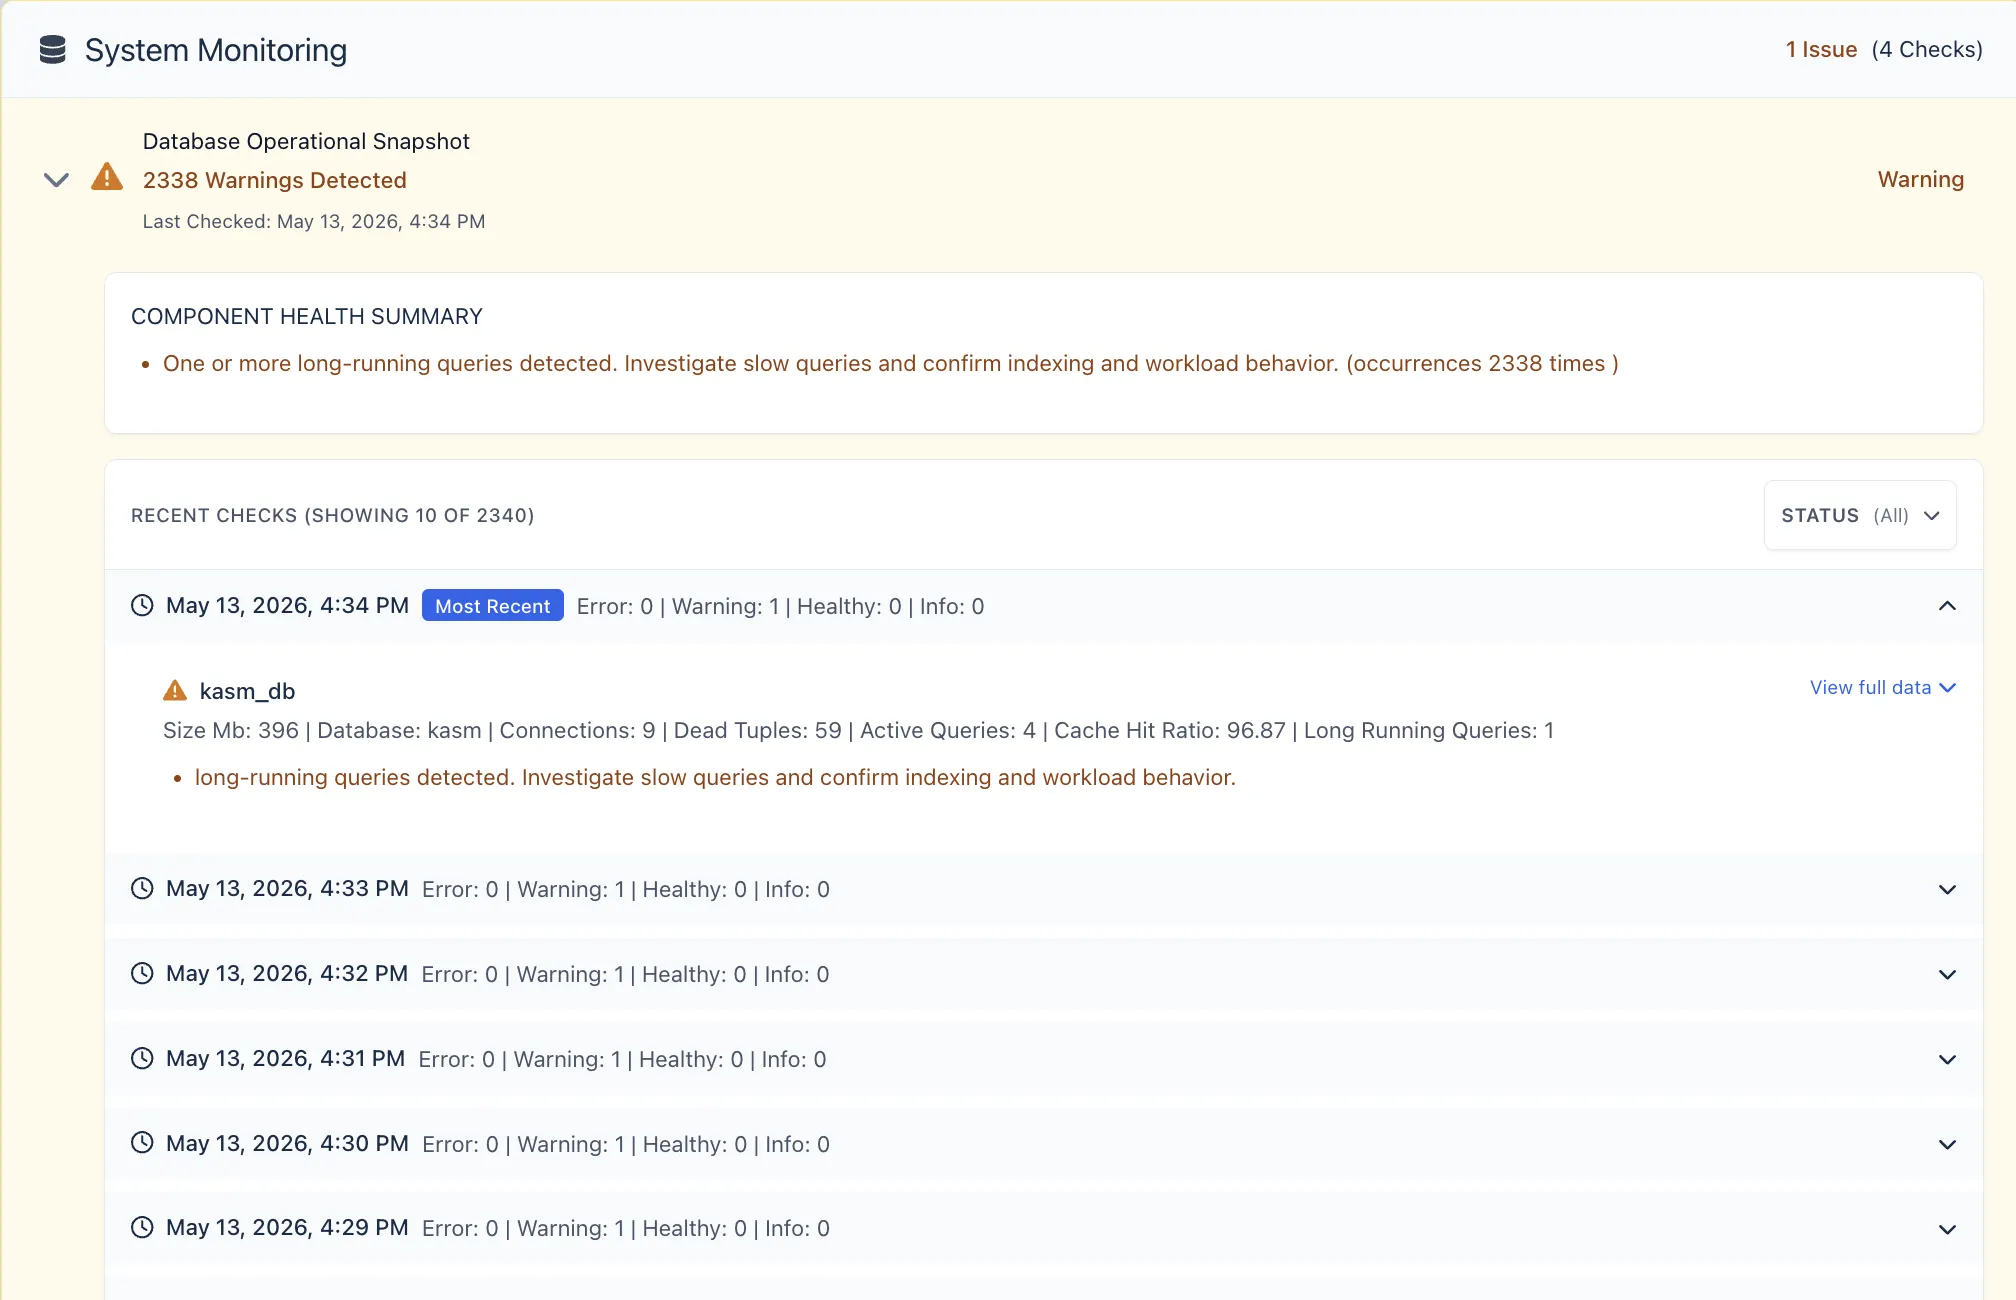
The component health summary can include the following fields.
| Field | Description |
|---|---|
| Problem | The condition detected by the check. |
| Occurrences | The number of times the condition occurred within the selected time range. |
| Zone | The affected zone, when zone data applies. |
| Severity | The status of the condition: Healthy, Info, Warning, or Error. |
Check filters
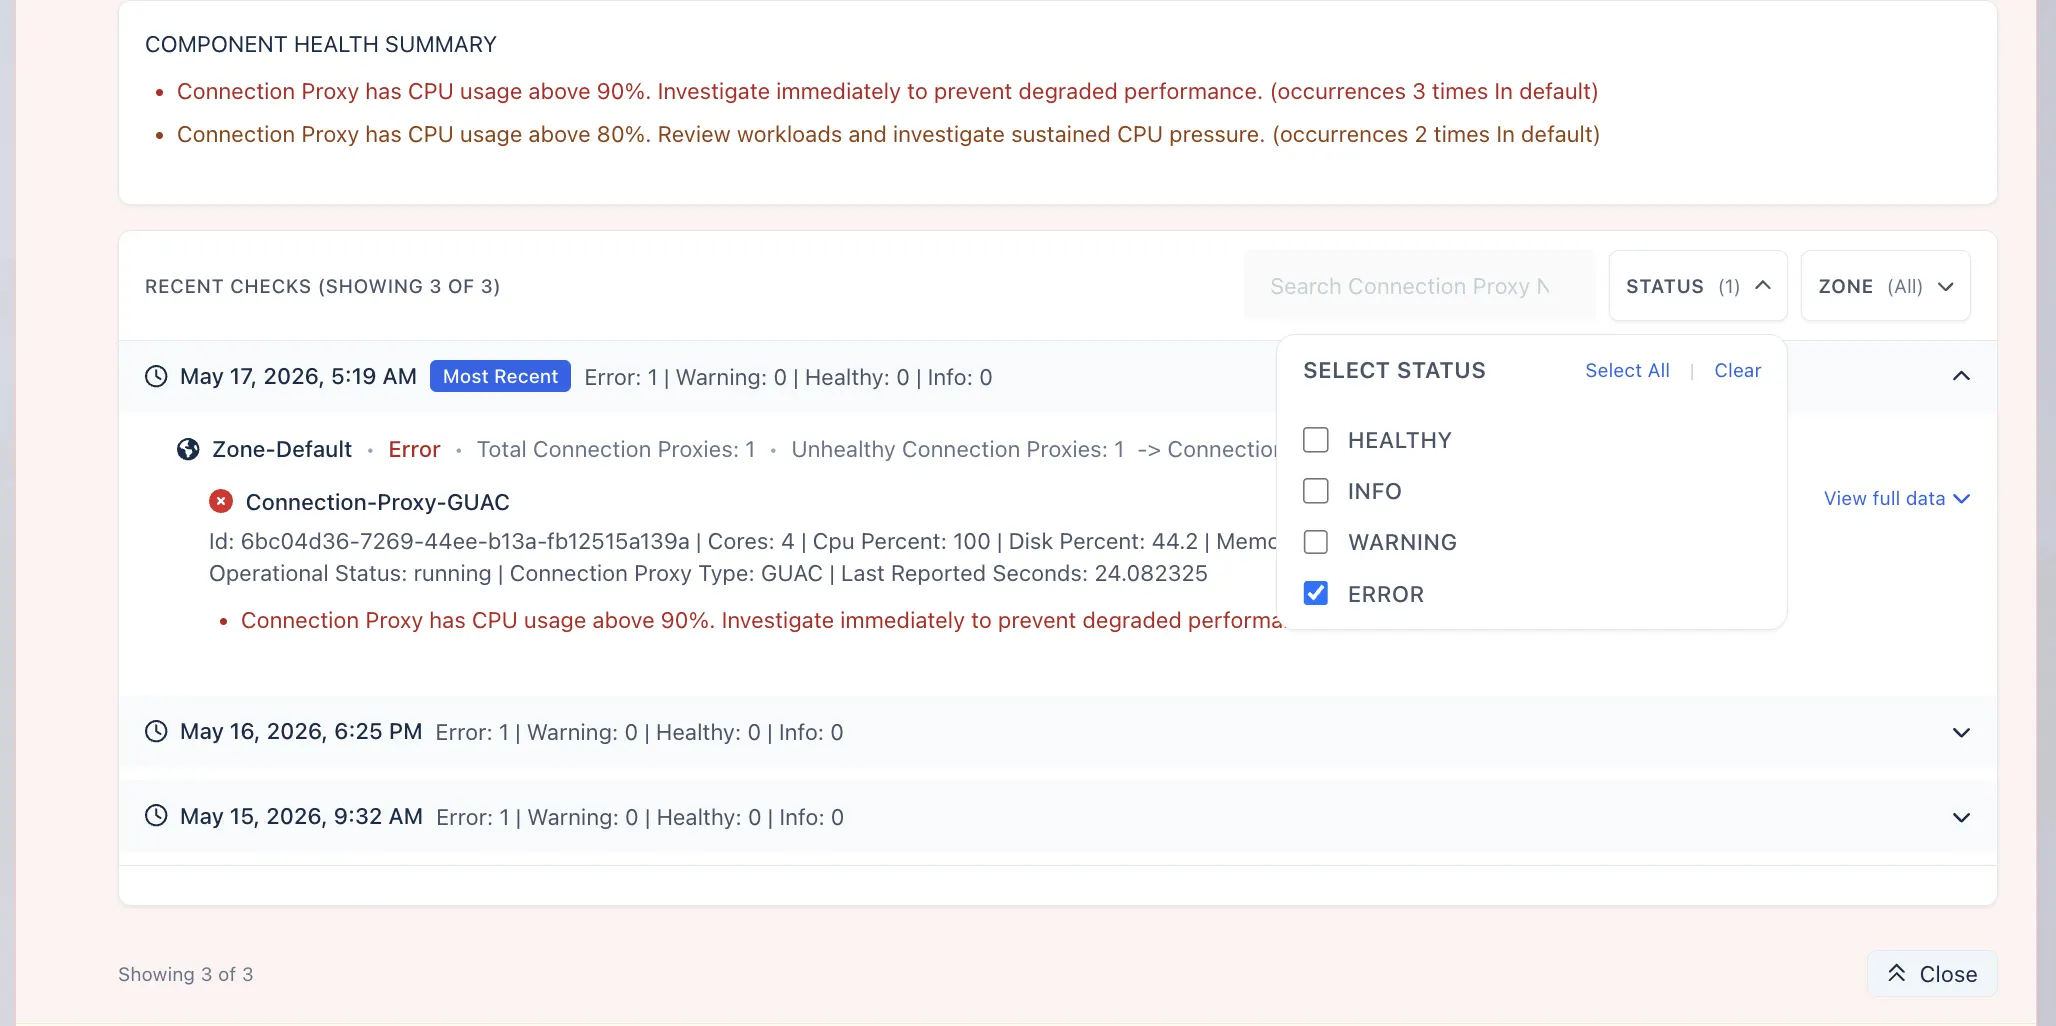
Recorded checks support filters that narrow the displayed results.
| Filter | Values |
|---|---|
| Status | Error, Warning, Info, or Healthy. |
| Zone | Available when the component is zone-based. |
| Time range | A specific period for which to review checks. |
Full metric data
The full data view displays the complete metric payload for a recorded check. The payload can include system metadata, resource usage, database details, query information, and other component-specific diagnostic data. The view supports copying the payload for offline review.
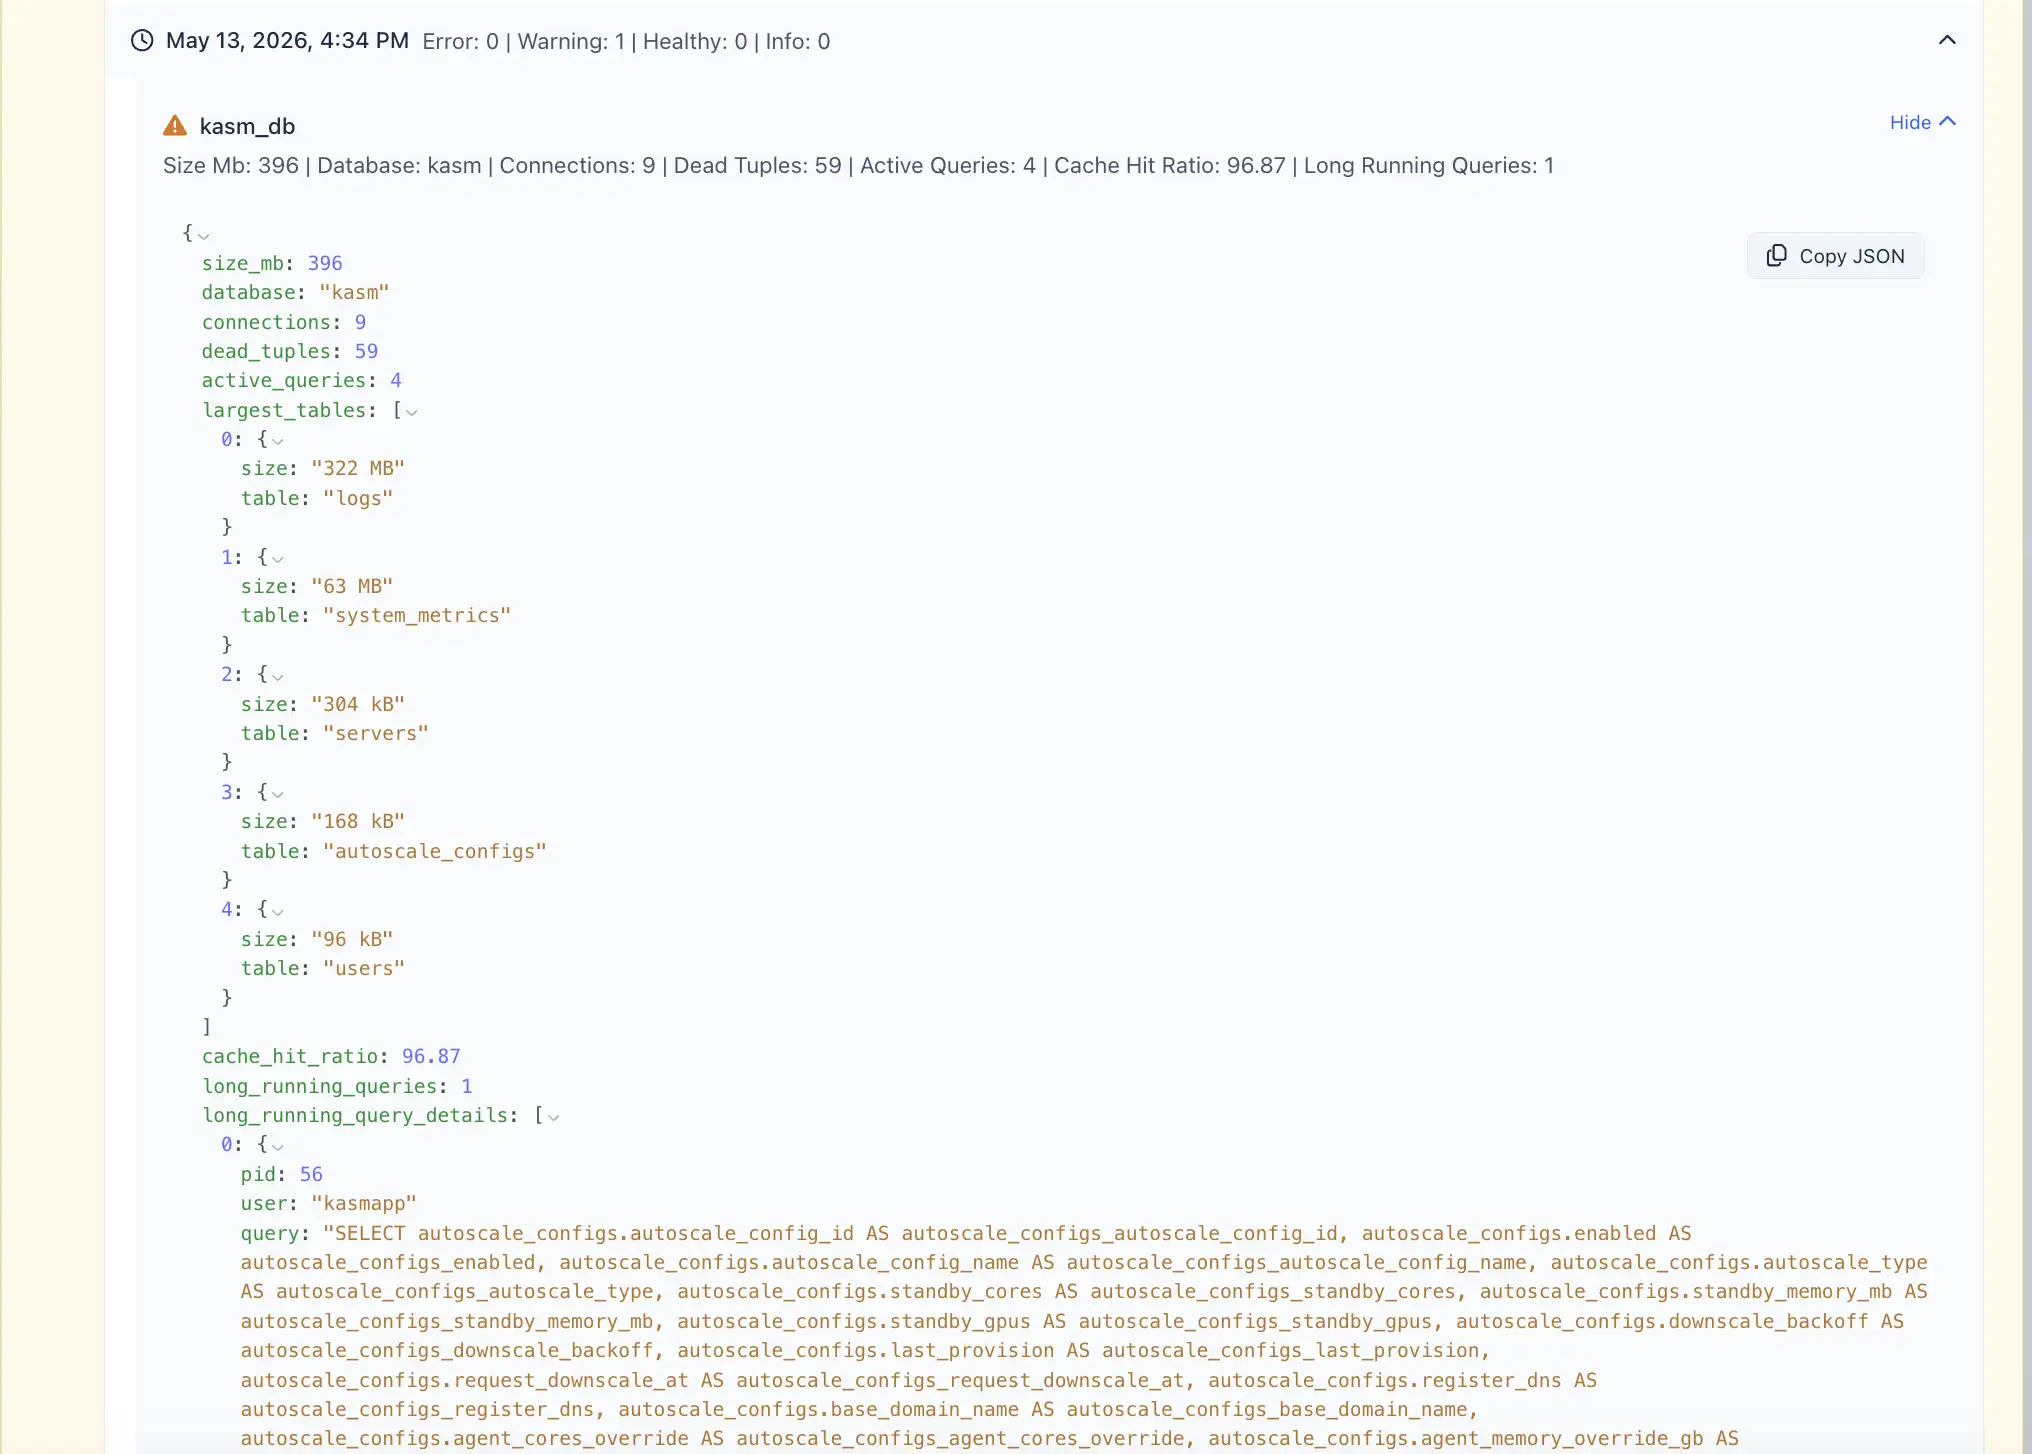
A Database Operational Snapshot payload can include the following fields.
| Field | Description |
|---|---|
| Database size | The total size of the database. |
| Active database connections | The number of open connections to the database. |
| Dead tuples | Row versions marked obsolete and awaiting cleanup. |
| Active queries | Queries running at the time of the snapshot. |
| Cache hit ratio | The proportion of reads served from cache rather than disk. |
| Long-running queries | Queries that exceed the expected execution time. |
| Table-level data | Per-table size and activity metrics. |
| Query details | Statement text and execution metadata for recorded queries. |
Dashboard customization
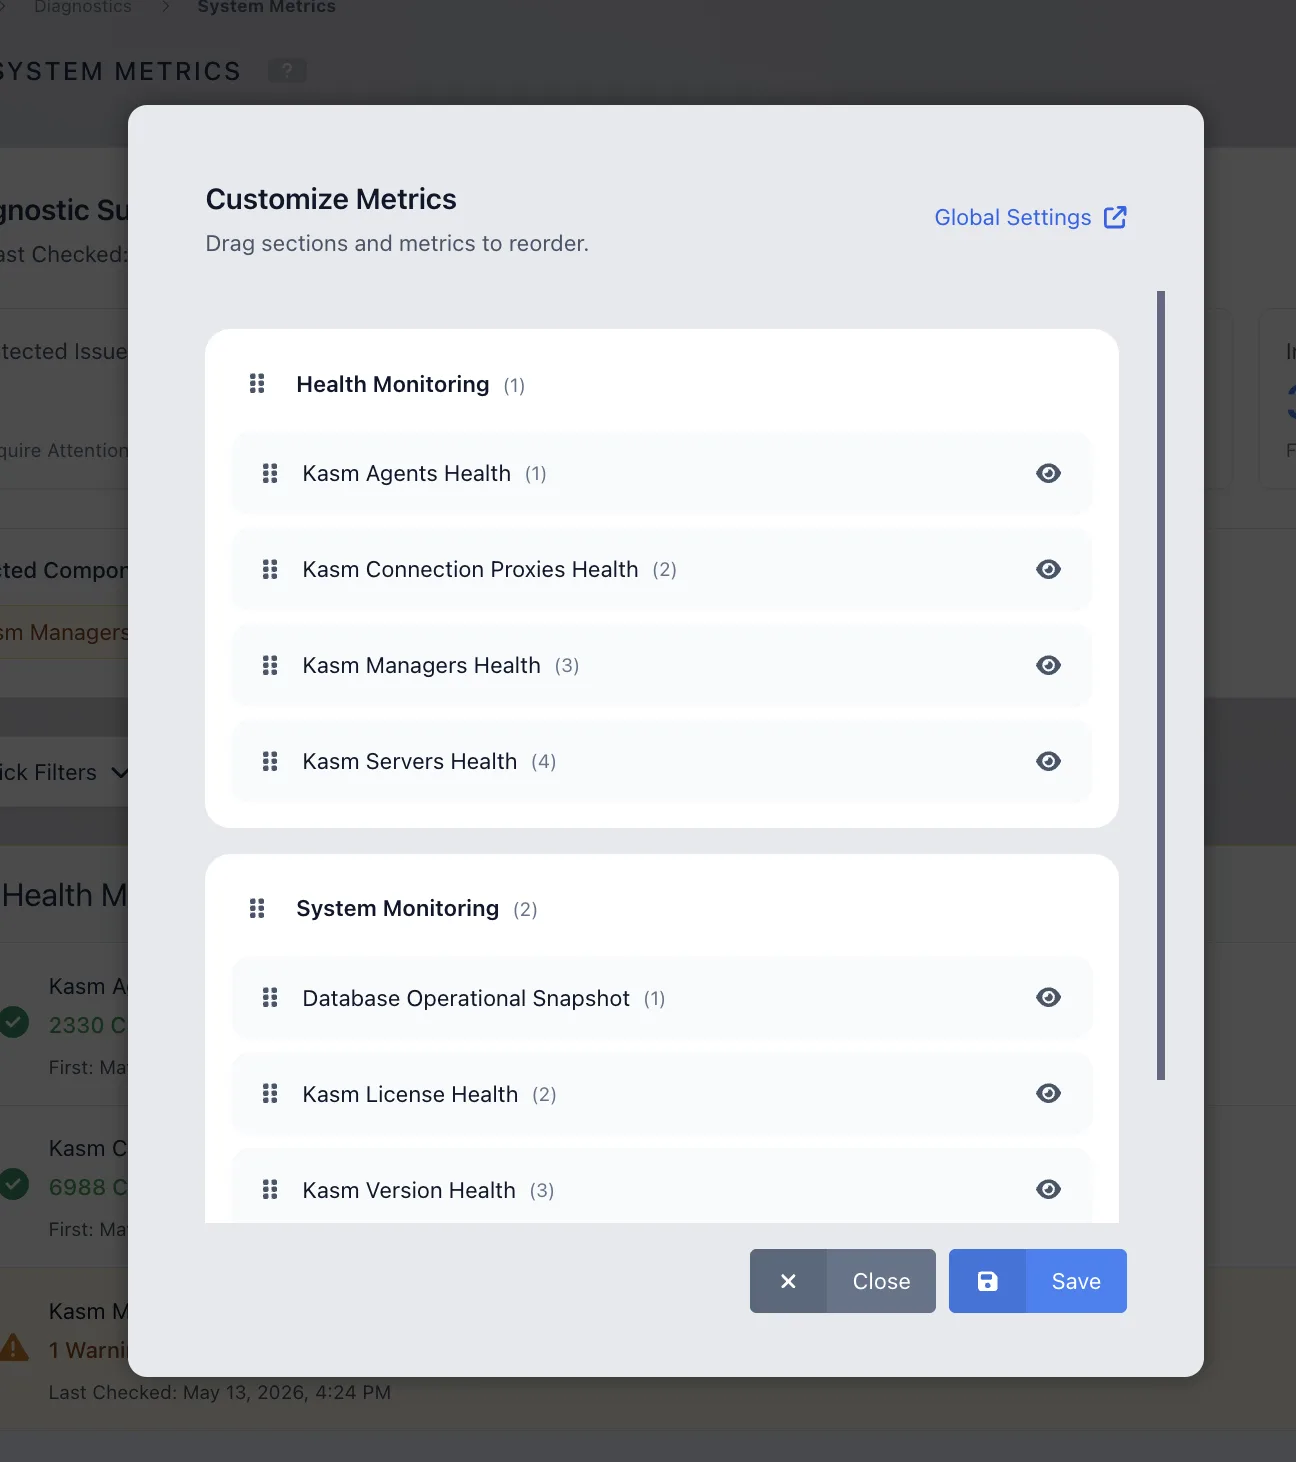
The dashboard supports reordering sections and components and hiding components from view. The Customize Metrics option exposes these controls, and Save persists the layout. Customization keeps the most relevant checks visible without changing which checks run.
System Metrics checks
System Metrics runs a set of default health checks against core Kasm Workspaces components. Each check returns one of the four statuses defined in Status colors. The tables below list the conditions that each check evaluates and the message returned for each condition.
The conditions documented below reflect the warning, error, and informational states that each check emits. A component reports Healthy when no listed condition applies. Confirm the full condition set against the running deployment, because messages are surfaced verbatim from the UI and can change across versions.
System Monitoring checks
System Monitoring evaluates non-zone-based components, including the database, license, Kasm version, and workspace images.
Database Operational Snapshot
The Database Operational Snapshot check reviews database size, connections, replication state, and query behavior.
| Condition | Status | Message |
|---|---|---|
| Database size is greater than 10 GB and less than or equal to 100 GB. | Warning | Database size is above 10 GB. Review growth trends and confirm backups/retention policies are still appropriate. |
| Database size is greater than 100 GB. | Warning | Database size is above 100 GB. Investigate rapid growth, check storage capacity, and plan scaling/archival. |
| One or more long-running queries are detected. | Warning | One or more long-running queries detected. Investigate slow queries and confirm indexing and workload behavior. |
Kasm License Health
The Kasm License Health check reviews whether a license exists and whether any configured license is close to expiration or already expired.
| Condition | Status | Message |
|---|---|---|
| No license is found. | Info | No license found. |
| One or more licenses expire within 30 days. | Warning | One or more licenses will expire within 30 days. Please plan to renew. |
| One or more licenses have expired. | Error | One or more licenses have expired. Please renew immediately to restore access. |
Kasm Version Health
The Kasm Version Health check reviews whether a Kasm Workspaces update is available.
| Condition | Status | Message |
|---|---|---|
| A Kasm update is available. | Warning | An update is available for Kasm. Review release notes and schedule an upgrade to stay current on fixes and security updates. |
Kasm Container Workspaces Health
The Kasm Container Workspaces Health check reviews whether workspace images are available and healthy.
| Condition | Status | Message |
|---|---|---|
| No workspace data is available. | Info | No workspaces have been added yet. |
| Workspace image data is stale, unavailable, or missing from the agent. | Error | Workspace images are unhealthy: image is stale/unavailable or missing on the agent. Check image sync/pulls, agent connectivity, and registry access. |
Health Monitoring checks
Health Monitoring evaluates zone-based components: Kasm Managers, Kasm Servers, Kasm Agents, and Kasm Connection Proxies. Each component reports availability, operational status, and resource usage. The four components share the resource thresholds defined in Resource usage thresholds. The tables below list the conditions specific to each component.
Kasm Managers Health
The Kasm Managers Health check reviews Manager availability, operational status, managed server status, and resource usage.
| Condition | Status | Message |
|---|---|---|
| No Manager data is available. | Info | No Manager data found. |
Manager status is not running or deleting. | Error | Manager is not in an expected state (running/deleting). Check server health, capacity, and recent failures. |
One or more Manager-managed servers are not running or deleting. | Error | Manager-managed servers are not in an expected state (running/deleting). Check the affected server(s) and recent events/logs. |
Kasm Servers Health
The Kasm Servers Health check reviews Server availability, operational status, and resource usage.
| Condition | Status | Message |
|---|---|---|
| No Server data is available. | Info | No Server data found. |
Server status is not running or deleting. | Error | Server is not in an expected state (running/deleting). Check server health, capacity, and recent failures. |
Kasm Agents Health
The Kasm Agents Health check reviews Agent availability, operational status, and resource usage.
| Condition | Status | Message |
|---|---|---|
| No Agent data is available. | Info | No Agents data found. |
Agent status is not running or deleting. | Error | Agent is not in an expected state (running/deleting). Check server health, capacity, and recent failures. |
Kasm Connection Proxies Health
The Kasm Connection Proxies Health check reviews Connection Proxy availability, operational status, and resource usage.
| Condition | Status | Message |
|---|---|---|
| No Connection Proxy data is available. | Info | No Connection Proxy data found. |
Connection Proxy status is not running or deleting. | Error | Connection Proxy is not in an expected state (running/deleting). Verify proxy service status and network reachability. |
Resource usage thresholds
Each Health Monitoring component applies the same resource thresholds for memory, CPU, and disk usage. A component returns Warning at the warning threshold and Error at the error threshold.
| Resource | Warning threshold | Error threshold |
|---|---|---|
| Memory usage | Above 80% | Above 90% |
| CPU usage | Above 80% | Above 90% |
| Disk usage | Above 80% | Above 90% |
A warning result indicates that the affected component requires review and capacity-trend investigation. An error result indicates that the component requires immediate action to prevent degraded performance or outages.
Confirm with Kasm engineering whether the resource thresholds and database size thresholds are fixed or configurable before treating them as authoritative for a specific version.
Global settings
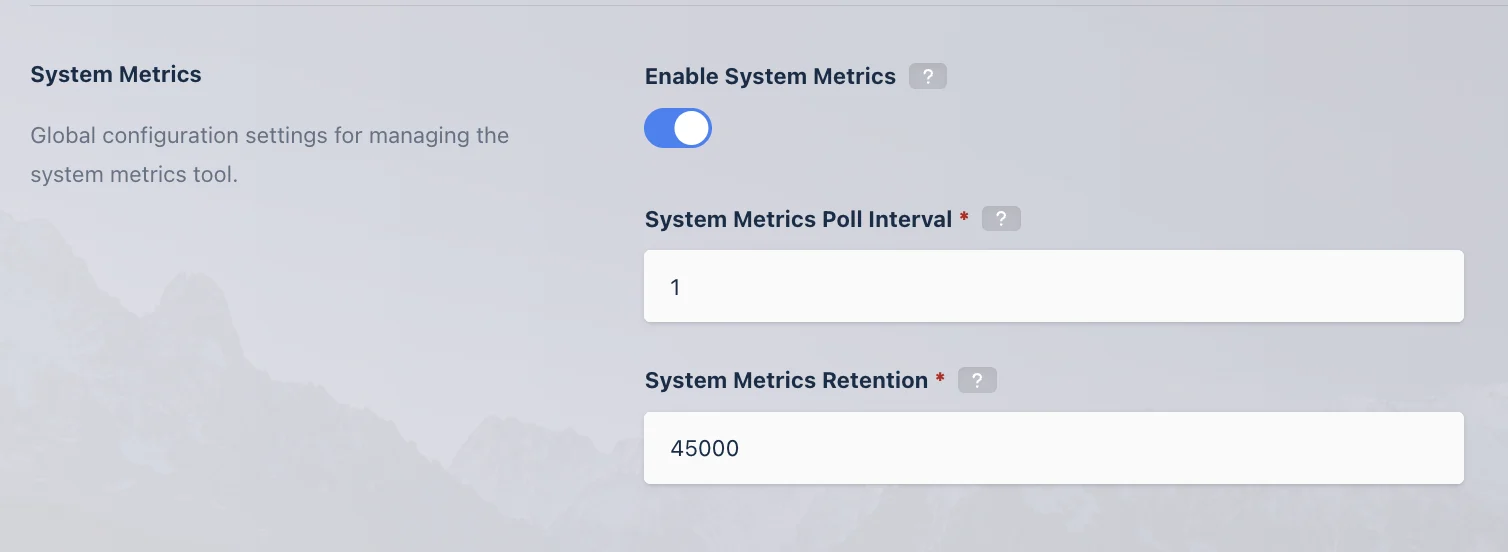
System Metrics is configured from the Global Settings page. The Global Settings page controls whether System Metrics is enabled, how often metrics are collected, and how many metric records are retained per component. The Customize Metrics modal links to the Global Settings page through the Global Settings button.

| Setting | Description |
|---|---|
Enable System Metrics | When enabled, the backend System Metrics module periodically collects snapshot logs for all essential components, checks their health, and displays the data on the System Metrics page. |
System Metrics Poll Interval | The interval, in minutes, at which the system collects and evaluates metrics. A lower value collects metrics more frequently. A higher value reduces how often checks run. |
System Metrics Retention | The number of metric records to retain per component. A higher value preserves more historical snapshots but increases stored metric data. |
For the global-settings field definitions, see the System Metrics settings reference.